Cuban vs Immigrants from Scotland Ambulatory Disability
COMPARE
Cuban
Immigrants from Scotland
Ambulatory Disability
Ambulatory Disability Comparison
Cubans
Immigrants from Scotland
6.4%
AMBULATORY DISABILITY
4.0/ 100
METRIC RATING
227th/ 347
METRIC RANK
6.0%
AMBULATORY DISABILITY
72.1/ 100
METRIC RATING
155th/ 347
METRIC RANK
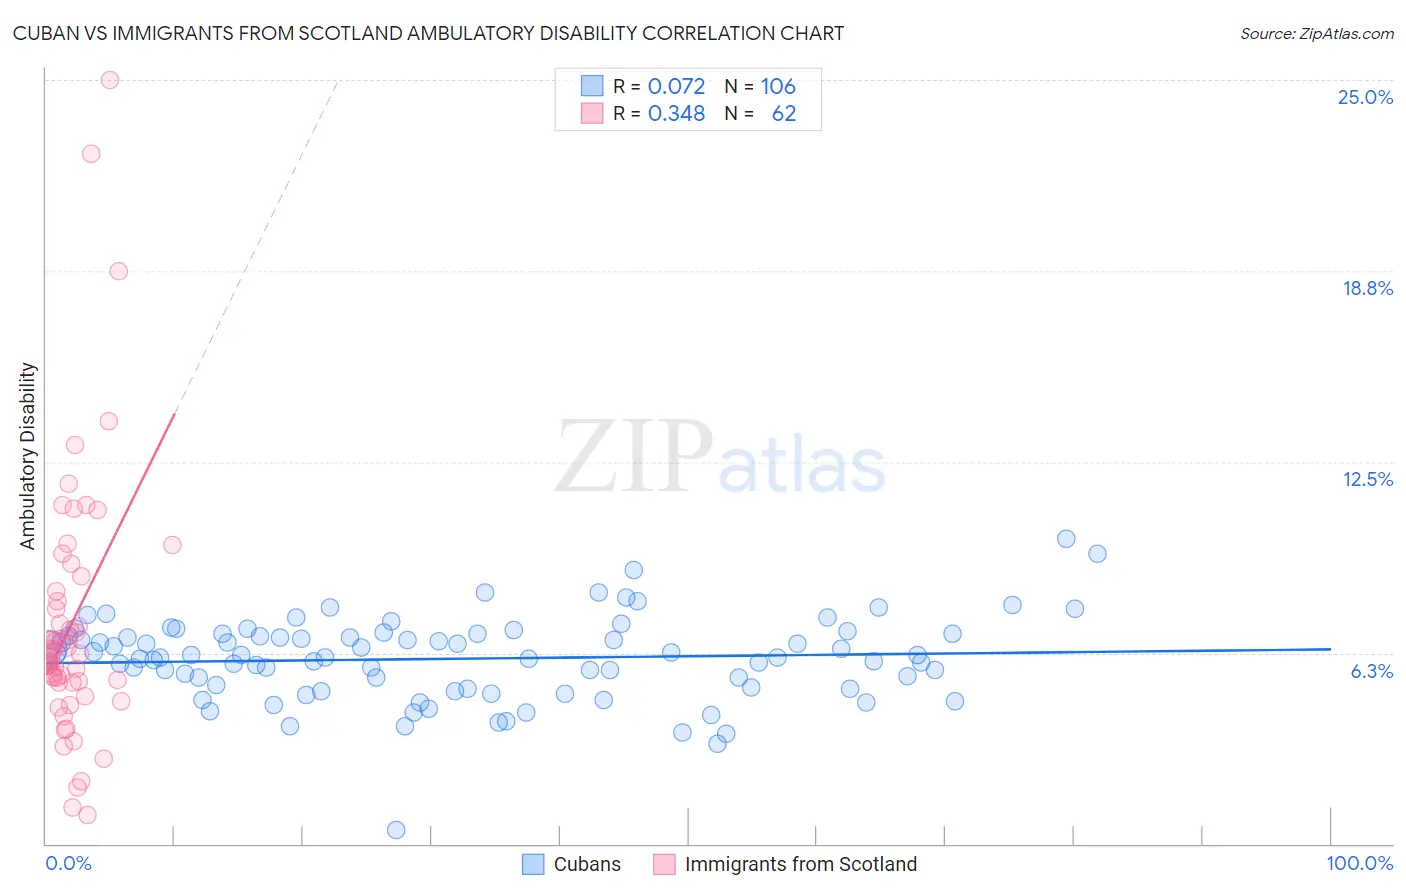
Cuban vs Immigrants from Scotland Ambulatory Disability Correlation Chart
The statistical analysis conducted on geographies consisting of 449,114,501 people shows a slight positive correlation between the proportion of Cubans and percentage of population with ambulatory disability in the United States with a correlation coefficient (R) of 0.072 and weighted average of 6.4%. Similarly, the statistical analysis conducted on geographies consisting of 196,384,965 people shows a mild positive correlation between the proportion of Immigrants from Scotland and percentage of population with ambulatory disability in the United States with a correlation coefficient (R) of 0.348 and weighted average of 6.0%, a difference of 5.5%.
Ambulatory Disability Correlation Summary
| Measurement | Cuban | Immigrants from Scotland |
| Minimum | 0.45% | 0.96% |
| Maximum | 10.0% | 25.0% |
| Range | 9.5% | 24.0% |
| Mean | 6.1% | 7.2% |
| Median | 6.1% | 6.2% |
| Interquartile 25% (IQ1) | 5.1% | 5.3% |
| Interquartile 75% (IQ3) | 6.9% | 8.2% |
| Interquartile Range (IQR) | 1.7% | 3.0% |
| Standard Deviation (Sample) | 1.4% | 4.4% |
| Standard Deviation (Population) | 1.4% | 4.3% |
Similar Demographics by Ambulatory Disability
Demographics Similar to Cubans by Ambulatory Disability
In terms of ambulatory disability, the demographic groups most similar to Cubans are Portuguese (6.4%, a difference of 0.010%), Czechoslovakian (6.4%, a difference of 0.060%), Mexican (6.4%, a difference of 0.17%), Panamanian (6.4%, a difference of 0.32%), and Slavic (6.4%, a difference of 0.33%).
| Demographics | Rating | Rank | Ambulatory Disability |
| Immigrants | Albania | 9.6 /100 | #220 | Tragic 6.3% |
| Hungarians | 9.6 /100 | #221 | Tragic 6.3% |
| German Russians | 9.4 /100 | #222 | Tragic 6.3% |
| Immigrants | Honduras | 7.6 /100 | #223 | Tragic 6.3% |
| Liberians | 7.1 /100 | #224 | Tragic 6.3% |
| Hondurans | 6.3 /100 | #225 | Tragic 6.3% |
| Slavs | 5.1 /100 | #226 | Tragic 6.4% |
| Cubans | 4.0 /100 | #227 | Tragic 6.4% |
| Portuguese | 4.0 /100 | #228 | Tragic 6.4% |
| Czechoslovakians | 3.8 /100 | #229 | Tragic 6.4% |
| Mexicans | 3.5 /100 | #230 | Tragic 6.4% |
| Panamanians | 3.1 /100 | #231 | Tragic 6.4% |
| Assyrians/Chaldeans/Syriacs | 2.4 /100 | #232 | Tragic 6.4% |
| Sub-Saharan Africans | 2.3 /100 | #233 | Tragic 6.4% |
| Immigrants | Liberia | 2.3 /100 | #234 | Tragic 6.4% |
Demographics Similar to Immigrants from Scotland by Ambulatory Disability
In terms of ambulatory disability, the demographic groups most similar to Immigrants from Scotland are Northern European (6.0%, a difference of 0.020%), Ghanaian (6.0%, a difference of 0.050%), Immigrants from Fiji (6.0%, a difference of 0.070%), Immigrants from Latvia (6.0%, a difference of 0.070%), and Central American (6.0%, a difference of 0.15%).
| Demographics | Rating | Rank | Ambulatory Disability |
| Immigrants | Eastern Europe | 82.0 /100 | #148 | Excellent 6.0% |
| Lithuanians | 81.9 /100 | #149 | Excellent 6.0% |
| Maltese | 81.6 /100 | #150 | Excellent 6.0% |
| Greeks | 79.6 /100 | #151 | Good 6.0% |
| Immigrants | Austria | 78.8 /100 | #152 | Good 6.0% |
| Syrians | 75.5 /100 | #153 | Good 6.0% |
| Immigrants | Croatia | 75.1 /100 | #154 | Good 6.0% |
| Immigrants | Scotland | 72.1 /100 | #155 | Good 6.0% |
| Northern Europeans | 71.8 /100 | #156 | Good 6.0% |
| Ghanaians | 71.3 /100 | #157 | Good 6.0% |
| Immigrants | Fiji | 71.2 /100 | #158 | Good 6.0% |
| Immigrants | Latvia | 71.1 /100 | #159 | Good 6.0% |
| Central Americans | 69.8 /100 | #160 | Good 6.0% |
| Immigrants | Belarus | 69.2 /100 | #161 | Good 6.1% |
| Nigerians | 67.1 /100 | #162 | Good 6.1% |