Subsaharan African vs Menominee Male Disability
COMPARE
Subsaharan African
Menominee
Male Disability
Male Disability Comparison
Sub-Saharan Africans
Menominee
11.8%
MALE DISABILITY
2.8/ 100
METRIC RATING
226th/ 347
METRIC RANK
15.0%
MALE DISABILITY
0.0/ 100
METRIC RATING
337th/ 347
METRIC RANK
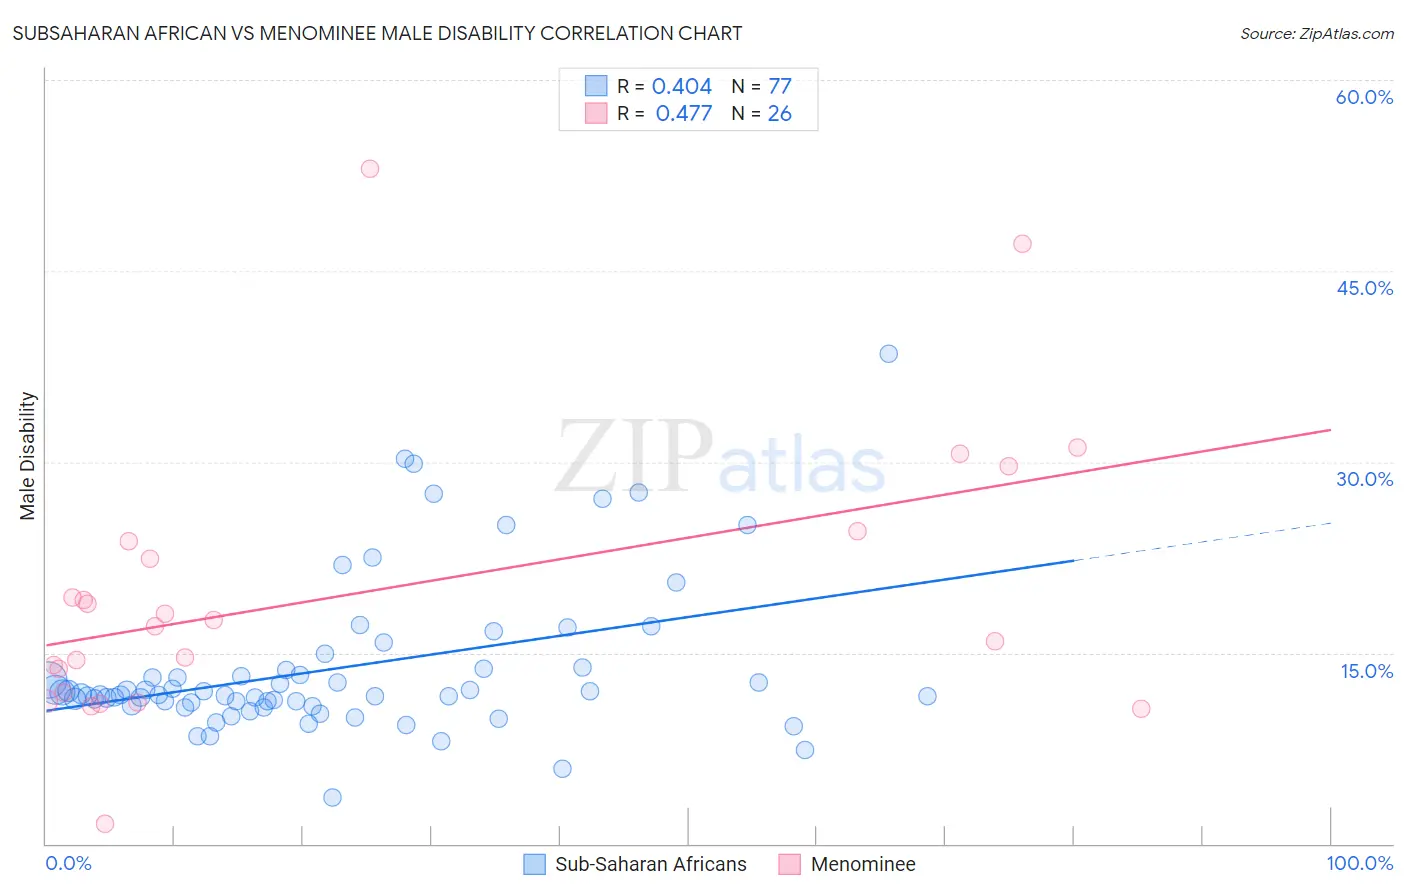
Subsaharan African vs Menominee Male Disability Correlation Chart
The statistical analysis conducted on geographies consisting of 508,010,863 people shows a moderate positive correlation between the proportion of Sub-Saharan Africans and percentage of males with a disability in the United States with a correlation coefficient (R) of 0.404 and weighted average of 11.8%. Similarly, the statistical analysis conducted on geographies consisting of 45,777,737 people shows a moderate positive correlation between the proportion of Menominee and percentage of males with a disability in the United States with a correlation coefficient (R) of 0.477 and weighted average of 15.0%, a difference of 27.4%.
Male Disability Correlation Summary
| Measurement | Subsaharan African | Menominee |
| Minimum | 3.6% | 1.6% |
| Maximum | 38.5% | 53.0% |
| Range | 34.8% | 51.5% |
| Mean | 13.8% | 19.7% |
| Median | 11.7% | 17.4% |
| Interquartile 25% (IQ1) | 11.0% | 11.9% |
| Interquartile 75% (IQ3) | 13.7% | 23.8% |
| Interquartile Range (IQR) | 2.8% | 11.9% |
| Standard Deviation (Sample) | 6.1% | 11.3% |
| Standard Deviation (Population) | 6.0% | 11.1% |
Similar Demographics by Male Disability
Demographics Similar to Sub-Saharan Africans by Male Disability
In terms of male disability, the demographic groups most similar to Sub-Saharan Africans are Liberian (11.8%, a difference of 0.12%), Japanese (11.7%, a difference of 0.13%), Immigrants from Bahamas (11.7%, a difference of 0.15%), Austrian (11.8%, a difference of 0.18%), and Alsatian (11.7%, a difference of 0.24%).
| Demographics | Rating | Rank | Male Disability |
| Panamanians | 3.8 /100 | #219 | Tragic 11.7% |
| Immigrants | Western Europe | 3.8 /100 | #220 | Tragic 11.7% |
| Immigrants | Congo | 3.7 /100 | #221 | Tragic 11.7% |
| Alsatians | 3.3 /100 | #222 | Tragic 11.7% |
| Immigrants | Bahamas | 3.2 /100 | #223 | Tragic 11.7% |
| Japanese | 3.1 /100 | #224 | Tragic 11.7% |
| Liberians | 3.1 /100 | #225 | Tragic 11.8% |
| Sub-Saharan Africans | 2.8 /100 | #226 | Tragic 11.8% |
| Austrians | 2.5 /100 | #227 | Tragic 11.8% |
| Hispanics or Latinos | 2.3 /100 | #228 | Tragic 11.8% |
| Bermudans | 2.3 /100 | #229 | Tragic 11.8% |
| Croatians | 2.1 /100 | #230 | Tragic 11.8% |
| Dominicans | 1.8 /100 | #231 | Tragic 11.8% |
| Malaysians | 1.8 /100 | #232 | Tragic 11.8% |
| Mexicans | 1.7 /100 | #233 | Tragic 11.8% |
Demographics Similar to Menominee by Male Disability
In terms of male disability, the demographic groups most similar to Menominee are Pueblo (15.0%, a difference of 0.11%), Alaskan Athabascan (14.9%, a difference of 0.51%), Chickasaw (15.1%, a difference of 0.91%), Dutch West Indian (14.8%, a difference of 0.97%), and Cherokee (14.8%, a difference of 1.0%).
| Demographics | Rating | Rank | Male Disability |
| Navajo | 0.0 /100 | #330 | Tragic 14.4% |
| Tohono O'odham | 0.0 /100 | #331 | Tragic 14.6% |
| Seminole | 0.0 /100 | #332 | Tragic 14.7% |
| Yuman | 0.0 /100 | #333 | Tragic 14.7% |
| Cherokee | 0.0 /100 | #334 | Tragic 14.8% |
| Dutch West Indians | 0.0 /100 | #335 | Tragic 14.8% |
| Alaskan Athabascans | 0.0 /100 | #336 | Tragic 14.9% |
| Menominee | 0.0 /100 | #337 | Tragic 15.0% |
| Pueblo | 0.0 /100 | #338 | Tragic 15.0% |
| Chickasaw | 0.0 /100 | #339 | Tragic 15.1% |
| Lumbee | 0.0 /100 | #340 | Tragic 15.2% |
| Choctaw | 0.0 /100 | #341 | Tragic 15.4% |
| Kiowa | 0.0 /100 | #342 | Tragic 15.4% |
| Creek | 0.0 /100 | #343 | Tragic 15.5% |
| Puerto Ricans | 0.0 /100 | #344 | Tragic 15.6% |