Belgian vs Ethiopian Disability
COMPARE
Belgian
Ethiopian
Disability
Disability Comparison
Belgians
Ethiopians
12.3%
DISABILITY
0.8/ 100
METRIC RATING
253rd/ 347
METRIC RANK
10.7%
DISABILITY
100.0/ 100
METRIC RATING
36th/ 347
METRIC RANK
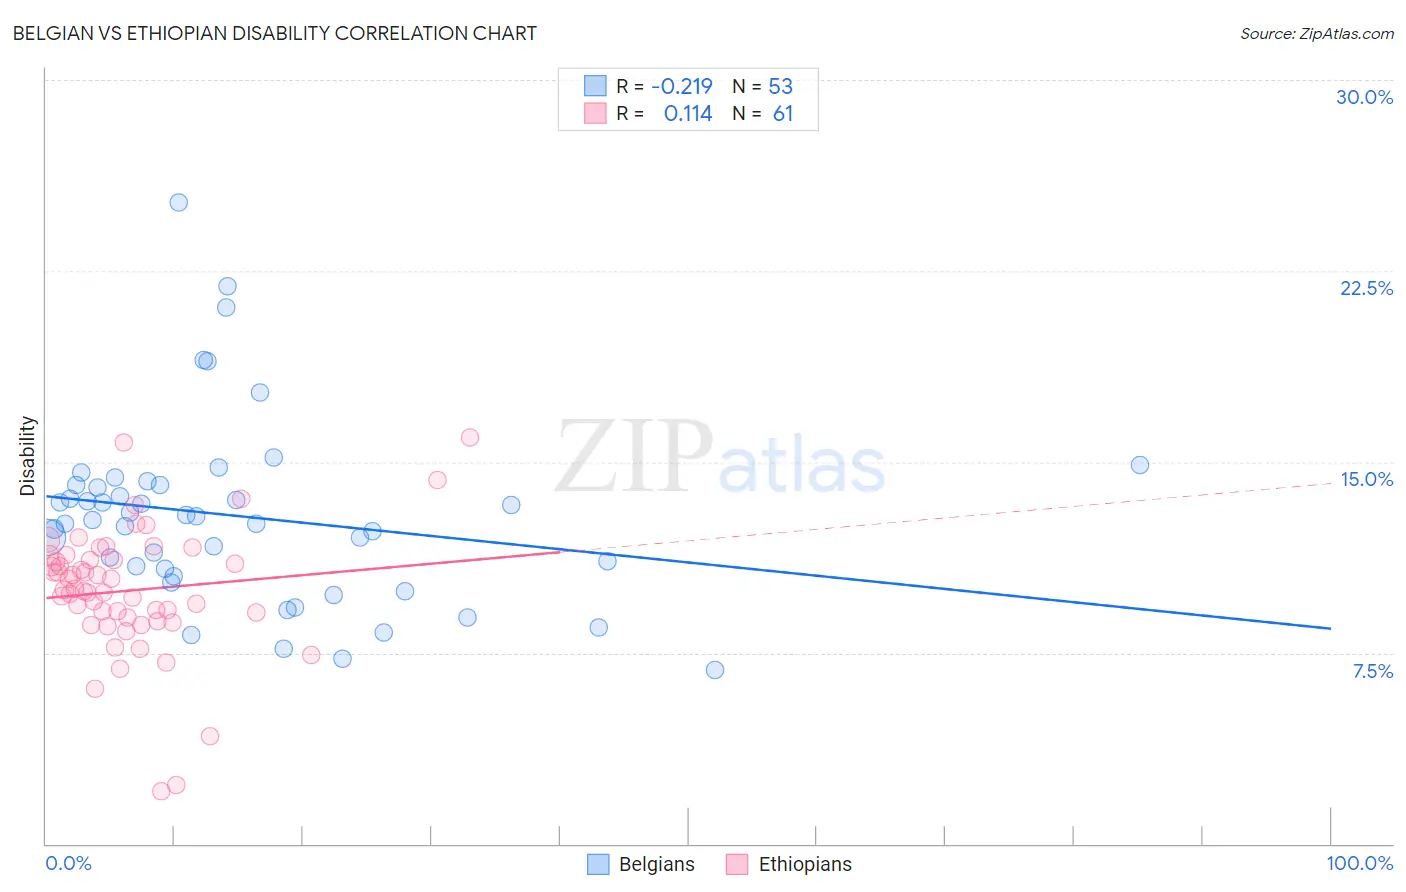
Belgian vs Ethiopian Disability Correlation Chart
The statistical analysis conducted on geographies consisting of 355,995,745 people shows a weak negative correlation between the proportion of Belgians and percentage of population with a disability in the United States with a correlation coefficient (R) of -0.219 and weighted average of 12.3%. Similarly, the statistical analysis conducted on geographies consisting of 223,240,308 people shows a poor positive correlation between the proportion of Ethiopians and percentage of population with a disability in the United States with a correlation coefficient (R) of 0.114 and weighted average of 10.7%, a difference of 15.0%.
Disability Correlation Summary
| Measurement | Belgian | Ethiopian |
| Minimum | 6.8% | 2.1% |
| Maximum | 25.2% | 15.9% |
| Range | 18.3% | 13.9% |
| Mean | 12.9% | 10.0% |
| Median | 12.7% | 10.0% |
| Interquartile 25% (IQ1) | 10.7% | 8.8% |
| Interquartile 75% (IQ3) | 14.1% | 11.2% |
| Interquartile Range (IQR) | 3.4% | 2.4% |
| Standard Deviation (Sample) | 3.6% | 2.5% |
| Standard Deviation (Population) | 3.6% | 2.5% |
Similar Demographics by Disability
Demographics Similar to Belgians by Disability
In terms of disability, the demographic groups most similar to Belgians are German Russian (12.3%, a difference of 0.030%), Bermudan (12.3%, a difference of 0.31%), Slovene (12.4%, a difference of 0.35%), Immigrants from Dominica (12.4%, a difference of 0.42%), and Subsaharan African (12.3%, a difference of 0.50%).
| Demographics | Rating | Rank | Disability |
| Swiss | 1.5 /100 | #246 | Tragic 12.2% |
| Indonesians | 1.4 /100 | #247 | Tragic 12.2% |
| Guamanians/Chamorros | 1.4 /100 | #248 | Tragic 12.3% |
| Carpatho Rusyns | 1.4 /100 | #249 | Tragic 12.3% |
| Sub-Saharan Africans | 1.4 /100 | #250 | Tragic 12.3% |
| Europeans | 1.4 /100 | #251 | Tragic 12.3% |
| Bermudans | 1.1 /100 | #252 | Tragic 12.3% |
| Belgians | 0.8 /100 | #253 | Tragic 12.3% |
| German Russians | 0.8 /100 | #254 | Tragic 12.3% |
| Slovenes | 0.6 /100 | #255 | Tragic 12.4% |
| Immigrants | Dominica | 0.6 /100 | #256 | Tragic 12.4% |
| Immigrants | Laos | 0.5 /100 | #257 | Tragic 12.4% |
| Slavs | 0.5 /100 | #258 | Tragic 12.4% |
| Canadians | 0.4 /100 | #259 | Tragic 12.4% |
| Immigrants | Liberia | 0.4 /100 | #260 | Tragic 12.4% |
Demographics Similar to Ethiopians by Disability
In terms of disability, the demographic groups most similar to Ethiopians are Turkish (10.7%, a difference of 0.010%), Immigrants from Indonesia (10.7%, a difference of 0.060%), Immigrants from Ethiopia (10.7%, a difference of 0.070%), Immigrants from Kuwait (10.7%, a difference of 0.29%), and Afghan (10.8%, a difference of 0.45%).
| Demographics | Rating | Rank | Disability |
| Immigrants | Argentina | 100.0 /100 | #29 | Exceptional 10.6% |
| Immigrants | Turkey | 100.0 /100 | #30 | Exceptional 10.6% |
| Immigrants | Egypt | 100.0 /100 | #31 | Exceptional 10.6% |
| Paraguayans | 100.0 /100 | #32 | Exceptional 10.6% |
| Immigrants | Kuwait | 100.0 /100 | #33 | Exceptional 10.7% |
| Immigrants | Ethiopia | 100.0 /100 | #34 | Exceptional 10.7% |
| Immigrants | Indonesia | 100.0 /100 | #35 | Exceptional 10.7% |
| Ethiopians | 100.0 /100 | #36 | Exceptional 10.7% |
| Turks | 100.0 /100 | #37 | Exceptional 10.7% |
| Afghans | 99.9 /100 | #38 | Exceptional 10.8% |
| Cambodians | 99.9 /100 | #39 | Exceptional 10.8% |
| Mongolians | 99.9 /100 | #40 | Exceptional 10.8% |
| Immigrants | Australia | 99.9 /100 | #41 | Exceptional 10.8% |
| Immigrants | Nepal | 99.9 /100 | #42 | Exceptional 10.8% |
| Israelis | 99.9 /100 | #43 | Exceptional 10.8% |