Immigrants from Kenya vs Ethiopian Disability
COMPARE
Immigrants from Kenya
Ethiopian
Disability
Disability Comparison
Immigrants from Kenya
Ethiopians
11.6%
DISABILITY
72.1/ 100
METRIC RATING
151st/ 347
METRIC RANK
10.7%
DISABILITY
100.0/ 100
METRIC RATING
36th/ 347
METRIC RANK
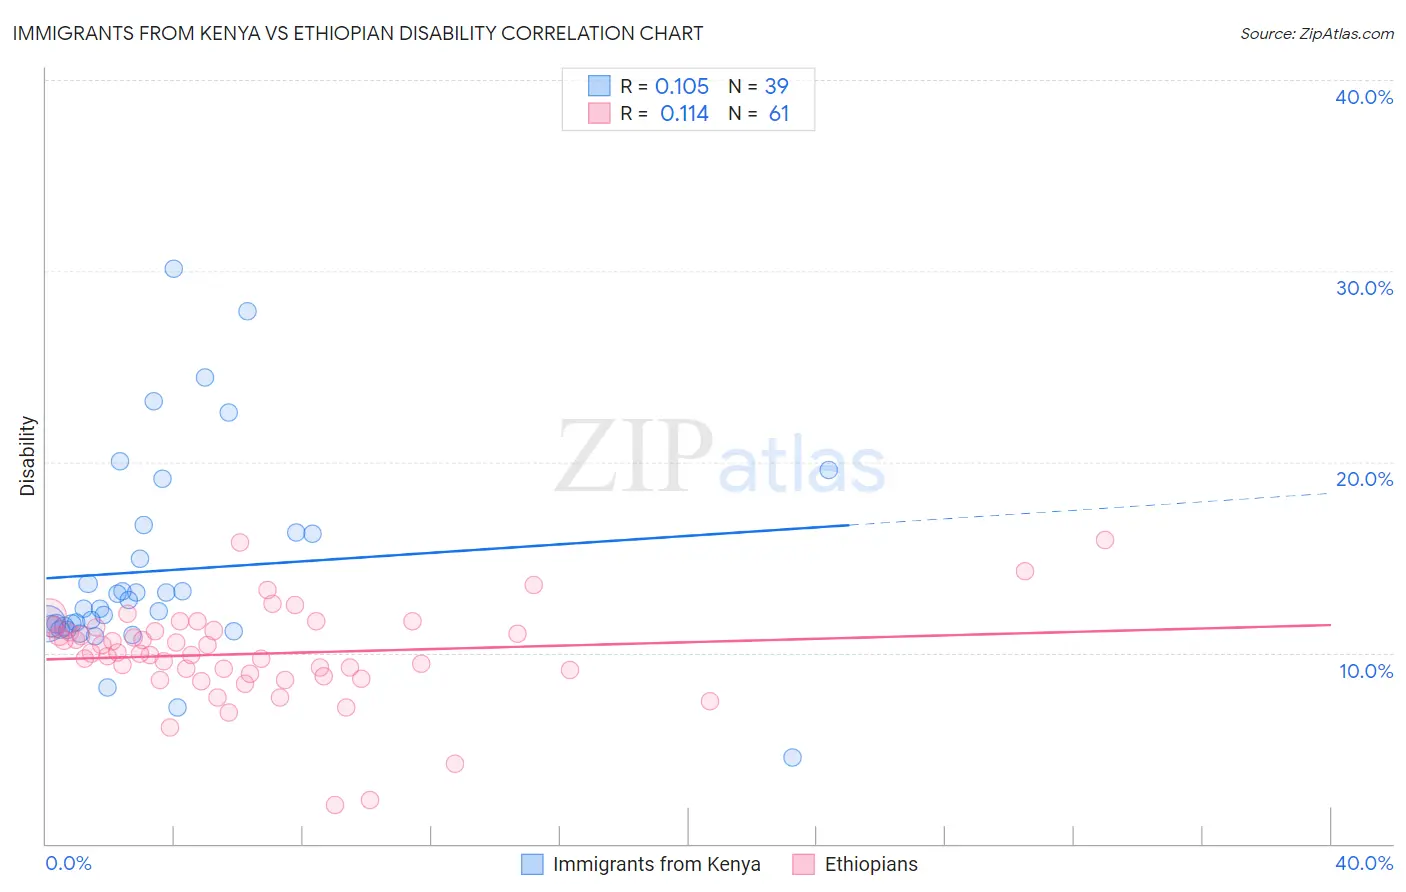
Immigrants from Kenya vs Ethiopian Disability Correlation Chart
The statistical analysis conducted on geographies consisting of 218,058,395 people shows a poor positive correlation between the proportion of Immigrants from Kenya and percentage of population with a disability in the United States with a correlation coefficient (R) of 0.105 and weighted average of 11.6%. Similarly, the statistical analysis conducted on geographies consisting of 223,240,308 people shows a poor positive correlation between the proportion of Ethiopians and percentage of population with a disability in the United States with a correlation coefficient (R) of 0.114 and weighted average of 10.7%, a difference of 8.1%.
Disability Correlation Summary
| Measurement | Immigrants from Kenya | Ethiopian |
| Minimum | 4.5% | 2.1% |
| Maximum | 30.1% | 15.9% |
| Range | 25.6% | 13.9% |
| Mean | 14.3% | 10.0% |
| Median | 12.3% | 10.0% |
| Interquartile 25% (IQ1) | 11.4% | 8.8% |
| Interquartile 75% (IQ3) | 16.3% | 11.2% |
| Interquartile Range (IQR) | 4.9% | 2.4% |
| Standard Deviation (Sample) | 5.4% | 2.5% |
| Standard Deviation (Population) | 5.3% | 2.5% |
Similar Demographics by Disability
Demographics Similar to Immigrants from Kenya by Disability
In terms of disability, the demographic groups most similar to Immigrants from Kenya are Immigrants from Moldova (11.6%, a difference of 0.0%), Romanian (11.6%, a difference of 0.030%), Immigrants from Ghana (11.6%, a difference of 0.050%), Immigrants from Guatemala (11.6%, a difference of 0.050%), and Immigrants from Norway (11.6%, a difference of 0.060%).
| Demographics | Rating | Rank | Disability |
| Australians | 82.5 /100 | #144 | Excellent 11.5% |
| Nigerians | 81.3 /100 | #145 | Excellent 11.5% |
| Immigrants | Hungary | 79.0 /100 | #146 | Good 11.5% |
| Immigrants | Ukraine | 77.6 /100 | #147 | Good 11.5% |
| Sudanese | 77.1 /100 | #148 | Good 11.5% |
| Immigrants | Norway | 73.2 /100 | #149 | Good 11.6% |
| Romanians | 72.7 /100 | #150 | Good 11.6% |
| Immigrants | Kenya | 72.1 /100 | #151 | Good 11.6% |
| Immigrants | Moldova | 72.0 /100 | #152 | Good 11.6% |
| Immigrants | Ghana | 71.2 /100 | #153 | Good 11.6% |
| Immigrants | Guatemala | 71.1 /100 | #154 | Good 11.6% |
| Immigrants | Netherlands | 69.8 /100 | #155 | Good 11.6% |
| Immigrants | Fiji | 69.5 /100 | #156 | Good 11.6% |
| Immigrants | Middle Africa | 69.5 /100 | #157 | Good 11.6% |
| Armenians | 65.9 /100 | #158 | Good 11.6% |
Demographics Similar to Ethiopians by Disability
In terms of disability, the demographic groups most similar to Ethiopians are Turkish (10.7%, a difference of 0.010%), Immigrants from Indonesia (10.7%, a difference of 0.060%), Immigrants from Ethiopia (10.7%, a difference of 0.070%), Immigrants from Kuwait (10.7%, a difference of 0.29%), and Afghan (10.8%, a difference of 0.45%).
| Demographics | Rating | Rank | Disability |
| Immigrants | Argentina | 100.0 /100 | #29 | Exceptional 10.6% |
| Immigrants | Turkey | 100.0 /100 | #30 | Exceptional 10.6% |
| Immigrants | Egypt | 100.0 /100 | #31 | Exceptional 10.6% |
| Paraguayans | 100.0 /100 | #32 | Exceptional 10.6% |
| Immigrants | Kuwait | 100.0 /100 | #33 | Exceptional 10.7% |
| Immigrants | Ethiopia | 100.0 /100 | #34 | Exceptional 10.7% |
| Immigrants | Indonesia | 100.0 /100 | #35 | Exceptional 10.7% |
| Ethiopians | 100.0 /100 | #36 | Exceptional 10.7% |
| Turks | 100.0 /100 | #37 | Exceptional 10.7% |
| Afghans | 99.9 /100 | #38 | Exceptional 10.8% |
| Cambodians | 99.9 /100 | #39 | Exceptional 10.8% |
| Mongolians | 99.9 /100 | #40 | Exceptional 10.8% |
| Immigrants | Australia | 99.9 /100 | #41 | Exceptional 10.8% |
| Immigrants | Nepal | 99.9 /100 | #42 | Exceptional 10.8% |
| Israelis | 99.9 /100 | #43 | Exceptional 10.8% |