Czechoslovakian vs Ethiopian Disability
COMPARE
Czechoslovakian
Ethiopian
Disability
Disability Comparison
Czechoslovakians
Ethiopians
12.5%
DISABILITY
0.2/ 100
METRIC RATING
266th/ 347
METRIC RANK
10.7%
DISABILITY
100.0/ 100
METRIC RATING
36th/ 347
METRIC RANK
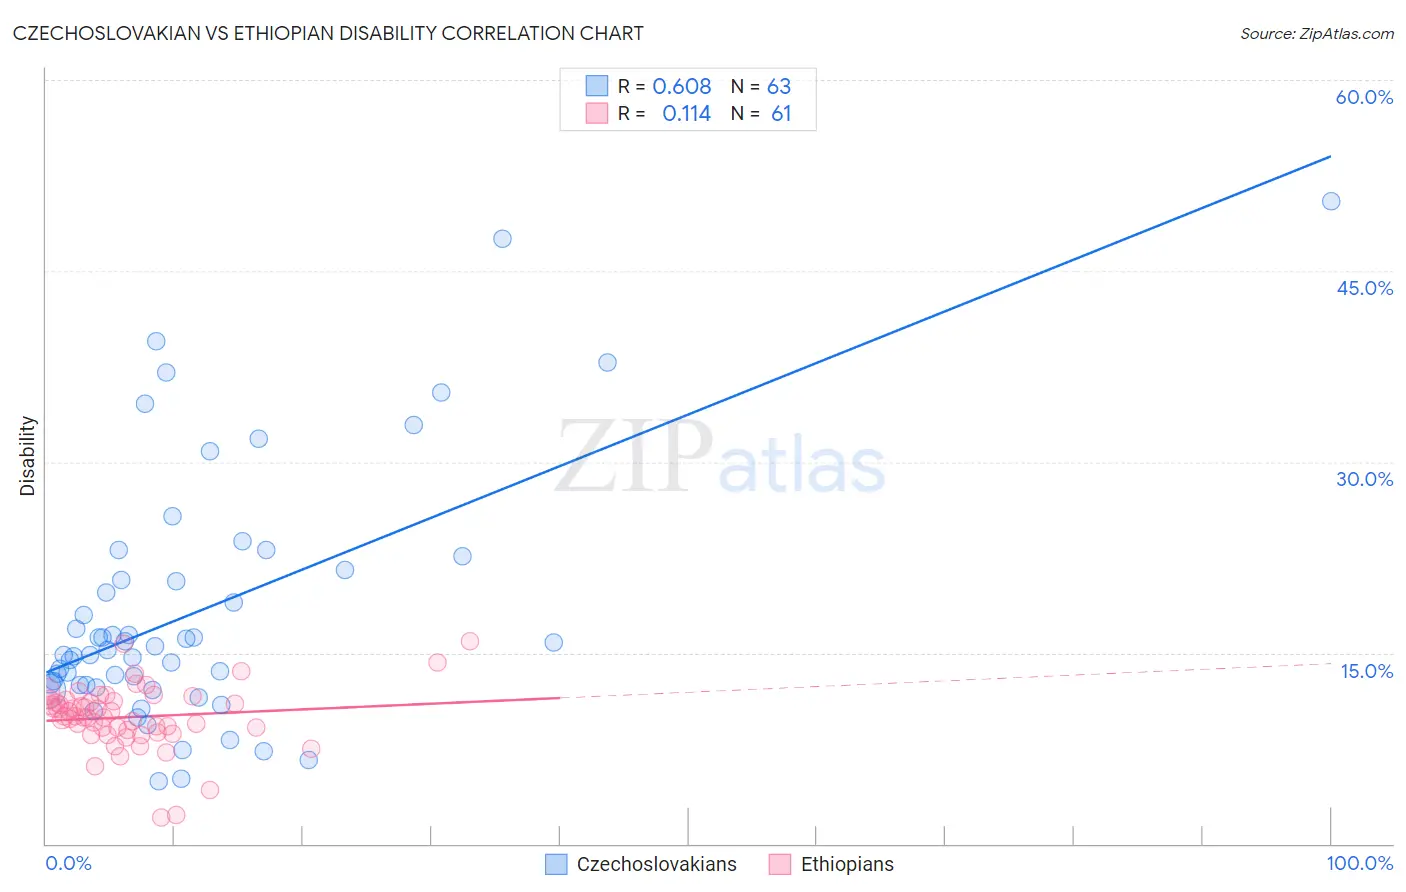
Czechoslovakian vs Ethiopian Disability Correlation Chart
The statistical analysis conducted on geographies consisting of 368,659,957 people shows a significant positive correlation between the proportion of Czechoslovakians and percentage of population with a disability in the United States with a correlation coefficient (R) of 0.608 and weighted average of 12.5%. Similarly, the statistical analysis conducted on geographies consisting of 223,240,308 people shows a poor positive correlation between the proportion of Ethiopians and percentage of population with a disability in the United States with a correlation coefficient (R) of 0.114 and weighted average of 10.7%, a difference of 16.9%.
Disability Correlation Summary
| Measurement | Czechoslovakian | Ethiopian |
| Minimum | 5.0% | 2.1% |
| Maximum | 50.5% | 15.9% |
| Range | 45.5% | 13.9% |
| Mean | 18.3% | 10.0% |
| Median | 15.2% | 10.0% |
| Interquartile 25% (IQ1) | 12.5% | 8.8% |
| Interquartile 75% (IQ3) | 21.6% | 11.2% |
| Interquartile Range (IQR) | 9.0% | 2.4% |
| Standard Deviation (Sample) | 9.9% | 2.5% |
| Standard Deviation (Population) | 9.8% | 2.5% |
Similar Demographics by Disability
Demographics Similar to Czechoslovakians by Disability
In terms of disability, the demographic groups most similar to Czechoslovakians are Spaniard (12.5%, a difference of 0.070%), U.S. Virgin Islander (12.5%, a difference of 0.16%), Immigrants from Germany (12.5%, a difference of 0.18%), Hawaiian (12.5%, a difference of 0.29%), and Bangladeshi (12.6%, a difference of 0.40%).
| Demographics | Rating | Rank | Disability |
| Canadians | 0.4 /100 | #259 | Tragic 12.4% |
| Immigrants | Liberia | 0.4 /100 | #260 | Tragic 12.4% |
| Scandinavians | 0.4 /100 | #261 | Tragic 12.4% |
| Native Hawaiians | 0.3 /100 | #262 | Tragic 12.5% |
| Hawaiians | 0.2 /100 | #263 | Tragic 12.5% |
| Immigrants | Germany | 0.2 /100 | #264 | Tragic 12.5% |
| U.S. Virgin Islanders | 0.2 /100 | #265 | Tragic 12.5% |
| Czechoslovakians | 0.2 /100 | #266 | Tragic 12.5% |
| Spaniards | 0.2 /100 | #267 | Tragic 12.5% |
| Bangladeshis | 0.1 /100 | #268 | Tragic 12.6% |
| Immigrants | Dominican Republic | 0.1 /100 | #269 | Tragic 12.6% |
| Portuguese | 0.1 /100 | #270 | Tragic 12.6% |
| Immigrants | Yemen | 0.1 /100 | #271 | Tragic 12.6% |
| Dominicans | 0.0 /100 | #272 | Tragic 12.7% |
| Finns | 0.0 /100 | #273 | Tragic 12.7% |
Demographics Similar to Ethiopians by Disability
In terms of disability, the demographic groups most similar to Ethiopians are Turkish (10.7%, a difference of 0.010%), Immigrants from Indonesia (10.7%, a difference of 0.060%), Immigrants from Ethiopia (10.7%, a difference of 0.070%), Immigrants from Kuwait (10.7%, a difference of 0.29%), and Afghan (10.8%, a difference of 0.45%).
| Demographics | Rating | Rank | Disability |
| Immigrants | Argentina | 100.0 /100 | #29 | Exceptional 10.6% |
| Immigrants | Turkey | 100.0 /100 | #30 | Exceptional 10.6% |
| Immigrants | Egypt | 100.0 /100 | #31 | Exceptional 10.6% |
| Paraguayans | 100.0 /100 | #32 | Exceptional 10.6% |
| Immigrants | Kuwait | 100.0 /100 | #33 | Exceptional 10.7% |
| Immigrants | Ethiopia | 100.0 /100 | #34 | Exceptional 10.7% |
| Immigrants | Indonesia | 100.0 /100 | #35 | Exceptional 10.7% |
| Ethiopians | 100.0 /100 | #36 | Exceptional 10.7% |
| Turks | 100.0 /100 | #37 | Exceptional 10.7% |
| Afghans | 99.9 /100 | #38 | Exceptional 10.8% |
| Cambodians | 99.9 /100 | #39 | Exceptional 10.8% |
| Mongolians | 99.9 /100 | #40 | Exceptional 10.8% |
| Immigrants | Australia | 99.9 /100 | #41 | Exceptional 10.8% |
| Immigrants | Nepal | 99.9 /100 | #42 | Exceptional 10.8% |
| Israelis | 99.9 /100 | #43 | Exceptional 10.8% |