Potawatomi vs Ethiopian 8th Grade

COMPARE

Potawatomi
Race
Ancestry
AfghanAfricanAlaska NativeAlaskan AthabascanAlbanianAleutAlsatianAmericanApacheArabArapahoArgentineanArmenianAssyrian/Chaldean/SyriacAustralianAustrianBahamianBangladeshiBarbadianBasqueBelgianBelizeanBermudanBhutaneseBlackfeetBolivianBrazilianBritishBritish West IndianBulgarianBurmeseCajunCambodianCanadianCape VerdeanCarpatho RusynCelticCentral AmericanCentral American IndianCherokeeCheyenneChickasawChileanChineseChippewaChoctawColombianColvilleComancheCosta RicanCreeCreekCroatianCrowCubanCypriotCzechCzechoslovakianDanishDelawareDominicanDutchDutch West IndianEastern EuropeanEcuadorianEgyptianEnglishEstonianEuropeanFijianFilipinoFinnishFrenchFrench American IndianFrench CanadianGermanGerman RussianGhanaianGreekGuamanian/ChamorroGuatemalanGuyaneseHaitianHmongHonduranHopiHoumaHungarianIcelanderIndian (Asian)IndonesianInupiatIranianIraqiIrishIroquoisIsraeliItalianJamaicanJapaneseJordanianKenyanKiowaKoreanLaotianLatvianLebaneseLiberianLithuanianLumbeeLuxembourgerMacedonianMalaysianMalteseMarshalleseMenomineeMexicanMexican American IndianMongolianMoroccanNative HawaiianNavajoNepaleseNew ZealanderNicaraguanNigerianNorthern EuropeanNorwegianOkinawanOsageOttawaPaiutePakistaniPalestinianPanamanianParaguayanPennsylvania GermanPeruvianPimaPolishPortuguesePotawatomiPuebloPuerto RicanPuget Sound SalishRomanianRussianSalvadoranSamoanScandinavianScotch-IrishScottishSeminoleSenegaleseSerbianShoshoneSierra LeoneanSiouxSlavicSlovakSloveneSomaliSouth AfricanSouth AmericanSouth American IndianSoviet UnionSpaniardSpanishSpanish AmericanSpanish American IndianSri LankanSubsaharan AfricanSudaneseSwedishSwissSyrianTaiwaneseThaiTlingit-HaidaTohono O'OdhamTonganTrinidadian and TobagonianTsimshianTurkishU.S. Virgin IslanderUgandanUkrainianUruguayanUteVenezuelanVietnameseWelshWest IndianYakamaYaquiYugoslavianYumanYup'ikZimbabwean
Immigration
NonimmigrantsImmigrantsAfghanistanAfricaAlbaniaArgentinaArmeniaAsiaAustraliaAustriaBahamasBangladeshBarbadosBelarusBelgiumBelizeBoliviaBosnia and HerzegovinaBrazilBulgariaBurma/MyanmarCabo VerdeCambodiaCameroonCanadaCaribbeanCentral AmericaChileChinaColombiaCongoCosta RicaCroatiaCubaCzechoslovakiaDenmarkDominicaDominican RepublicEastern AfricaEastern AsiaEastern EuropeEcuadorEgyptEl SalvadorEnglandEritreaEthiopiaEuropeFijiFranceGermanyGhanaGreeceGrenadaGuatemalaGuyanaHaitiHondurasHong KongHungaryIndiaIndonesiaIranIraqIrelandIsraelItalyJamaicaJapanJordanKazakhstanKenyaKoreaKuwaitLaosLatin AmericaLatviaLebanonLiberiaLithuaniaMalaysiaMexicoMicronesiaMiddle AfricaMoldovaMoroccoNepalNetherlandsNicaraguaNigeriaNorth AmericaNorth MacedoniaNorthern AfricaNorthern EuropeNorwayOceaniaPakistanPanamaPeruPhilippinesPolandPortugalRomaniaRussiaSaudi ArabiaScotlandSenegalSerbiaSierra LeoneSingaporeSomaliaSouth AfricaSouth AmericaSouth Central AsiaSouth Eastern AsiaSouthern EuropeSpainSri LankaSt. Vincent and the GrenadinesSudanSwedenSwitzerlandSyriaTaiwanThailandTrinidad and TobagoTurkeyUgandaUkraineUruguayUzbekistanVenezuelaVietnamWest IndiesWestern AfricaWestern AsiaWestern EuropeYemenZaireZimbabweAzores
Ethiopian
Race
Ancestry
AfghanAfricanAlaska NativeAlaskan AthabascanAlbanianAleutAlsatianAmericanApacheArabArapahoArgentineanArmenianAssyrian/Chaldean/SyriacAustralianAustrianBahamianBangladeshiBarbadianBasqueBelgianBelizeanBermudanBhutaneseBlackfeetBolivianBrazilianBritishBritish West IndianBulgarianBurmeseCajunCambodianCanadianCape VerdeanCarpatho RusynCelticCentral AmericanCentral American IndianCherokeeCheyenneChickasawChileanChineseChippewaChoctawColombianColvilleComancheCosta RicanCreeCreekCroatianCrowCubanCypriotCzechCzechoslovakianDanishDelawareDominicanDutchDutch West IndianEastern EuropeanEcuadorianEgyptianEnglishEstonianEthiopianEuropeanFijianFilipinoFinnishFrenchFrench American IndianFrench CanadianGermanGerman RussianGhanaianGreekGuamanian/ChamorroGuatemalanGuyaneseHaitianHmongHonduranHopiHoumaHungarianIcelanderIndian (Asian)IndonesianInupiatIranianIraqiIrishIroquoisIsraeliItalianJamaicanJapaneseJordanianKenyanKiowaKoreanLaotianLatvianLebaneseLiberianLithuanianLumbeeLuxembourgerMacedonianMalaysianMalteseMarshalleseMenomineeMexicanMexican American IndianMongolianMoroccanNative HawaiianNavajoNepaleseNew ZealanderNicaraguanNigerianNorthern EuropeanNorwegianOkinawanOsageOttawaPaiutePakistaniPalestinianPanamanianParaguayanPennsylvania GermanPeruvianPimaPolishPortuguesePuebloPuerto RicanPuget Sound SalishRomanianRussianSalvadoranSamoanScandinavianScotch-IrishScottishSeminoleSenegaleseSerbianShoshoneSierra LeoneanSiouxSlavicSlovakSloveneSomaliSouth AfricanSouth AmericanSouth American IndianSoviet UnionSpaniardSpanishSpanish AmericanSpanish American IndianSri LankanSubsaharan AfricanSudaneseSwedishSwissSyrianTaiwaneseThaiTlingit-HaidaTohono O'OdhamTonganTrinidadian and TobagonianTsimshianTurkishU.S. Virgin IslanderUgandanUkrainianUruguayanUteVenezuelanVietnameseWelshWest IndianYakamaYaquiYugoslavianYumanYup'ikZimbabwean
Immigration
NonimmigrantsImmigrantsAfghanistanAfricaAlbaniaArgentinaArmeniaAsiaAustraliaAustriaBahamasBangladeshBarbadosBelarusBelgiumBelizeBoliviaBosnia and HerzegovinaBrazilBulgariaBurma/MyanmarCabo VerdeCambodiaCameroonCanadaCaribbeanCentral AmericaChileChinaColombiaCongoCosta RicaCroatiaCubaCzechoslovakiaDenmarkDominicaDominican RepublicEastern AfricaEastern AsiaEastern EuropeEcuadorEgyptEl SalvadorEnglandEritreaEthiopiaEuropeFijiFranceGermanyGhanaGreeceGrenadaGuatemalaGuyanaHaitiHondurasHong KongHungaryIndiaIndonesiaIranIraqIrelandIsraelItalyJamaicaJapanJordanKazakhstanKenyaKoreaKuwaitLaosLatin AmericaLatviaLebanonLiberiaLithuaniaMalaysiaMexicoMicronesiaMiddle AfricaMoldovaMoroccoNepalNetherlandsNicaraguaNigeriaNorth AmericaNorth MacedoniaNorthern AfricaNorthern EuropeNorwayOceaniaPakistanPanamaPeruPhilippinesPolandPortugalRomaniaRussiaSaudi ArabiaScotlandSenegalSerbiaSierra LeoneSingaporeSomaliaSouth AfricaSouth AmericaSouth Central AsiaSouth Eastern AsiaSouthern EuropeSpainSri LankaSt. Vincent and the GrenadinesSudanSwedenSwitzerlandSyriaTaiwanThailandTrinidad and TobagoTurkeyUgandaUkraineUruguayUzbekistanVenezuelaVietnamWest IndiesWestern AfricaWestern AsiaWestern EuropeYemenZaireZimbabweAzores
8th Grade
Income
Poverty
Unemployment
Labor Participation
Family Structure
Vehicle Availability
Education Level
Disability

8th Grade Comparison

Potawatomi

Ethiopians

Exceptional
Tragic
96.4%
8TH GRADE
98.7/ 100
METRIC RATING
96th/ 347
METRIC RANK
95.1%
8TH GRADE
2.0/ 100
METRIC RATING
240th/ 347
METRIC RANK

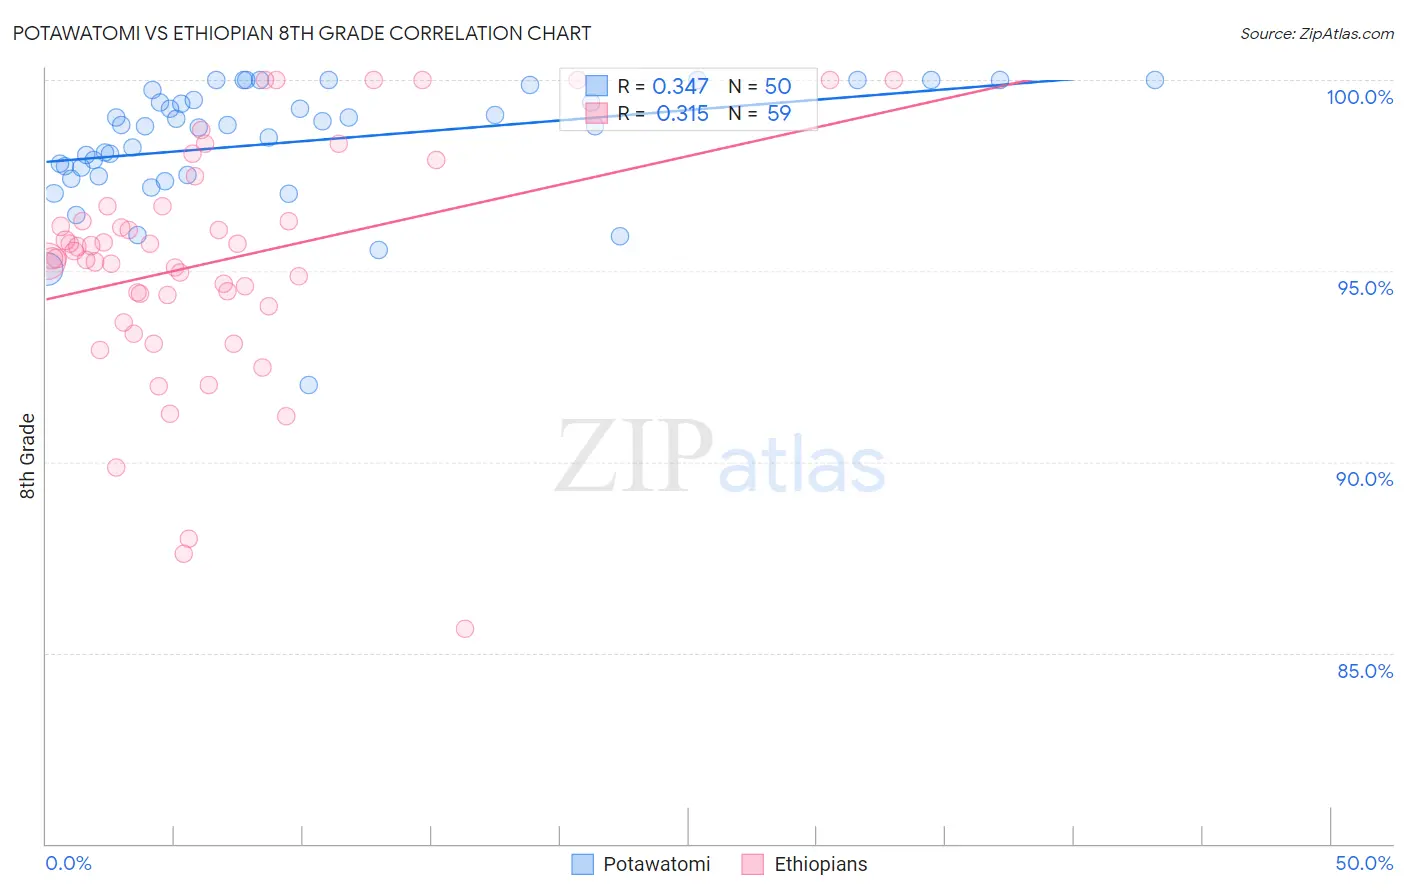
Potawatomi vs Ethiopian 8th Grade Correlation Chart

The statistical analysis conducted on geographies consisting of 117,769,196 people shows a mild positive correlation between the proportion of Potawatomi and percentage of population with at least 8th grade education in the United States with a correlation coefficient (R) of 0.347 and weighted average of 96.4%. Similarly, the statistical analysis conducted on geographies consisting of 223,135,094 people shows a mild positive correlation between the proportion of Ethiopians and percentage of population with at least 8th grade education in the United States with a correlation coefficient (R) of 0.315 and weighted average of 95.1%, a difference of 1.3%.
Potawatomi vs Ethiopian 8th Grade

8th Grade Correlation Summary

MeasurementPotawatomiEthiopian
Minimum92.0%85.6%
Maximum100.0%100.0%
Range8.0%14.4%
Mean98.4%95.2%
Median98.8%95.3%
Interquartile 25% (IQ1)97.5%94.1%
Interquartile 75% (IQ3)99.5%96.7%
Interquartile Range (IQR)2.0%2.6%
Standard Deviation (Sample)1.6%3.1%
Standard Deviation (Population)1.6%3.0%

Similar Demographics by 8th Grade

Demographics Similar to Potawatomi by 8th Grade

In terms of 8th grade, the demographic groups most similar to Potawatomi are Osage (96.4%, a difference of 0.0%), Immigrants from Germany (96.4%, a difference of 0.0%), Immigrants from Singapore (96.4%, a difference of 0.010%), German Russian (96.4%, a difference of 0.010%), and Cree (96.4%, a difference of 0.010%).
DemographicsRating | Rank8th Grade
Chickasaw
98.9
/100
|
#89
Exceptional
96.4%
Immigrants | Sweden
98.9
/100
|
#90
Exceptional
96.4%
Thais
98.9
/100
|
#91
Exceptional
96.4%
Menominee
98.9
/100
|
#92
Exceptional
96.4%
Immigrants | Denmark
98.8
/100
|
#93
Exceptional
96.4%
Immigrants | Singapore
98.8
/100
|
#94
Exceptional
96.4%
German Russians
98.8
/100
|
#95
Exceptional
96.4%
Potawatomi
98.7
/100
|
#96
Exceptional
96.4%
Osage
98.7
/100
|
#97
Exceptional
96.4%
Immigrants | Germany
98.7
/100
|
#98
Exceptional
96.4%
Cree
98.6
/100
|
#99
Exceptional
96.4%
Immigrants | Czechoslovakia
98.6
/100
|
#100
Exceptional
96.4%
Bhutanese
98.2
/100
|
#101
Exceptional
96.4%
South Africans
98.2
/100
|
#102
Exceptional
96.4%
Immigrants | Saudi Arabia
98.0
/100
|
#103
Exceptional
96.3%

Demographics Similar to Ethiopians by 8th Grade

In terms of 8th grade, the demographic groups most similar to Ethiopians are Immigrants from Sierra Leone (95.1%, a difference of 0.0%), South American Indian (95.1%, a difference of 0.010%), Native/Alaskan (95.2%, a difference of 0.020%), Tongan (95.1%, a difference of 0.020%), and Paiute (95.1%, a difference of 0.030%).
DemographicsRating | Rank8th Grade
Immigrants | Asia
3.1
/100
|
#233
Tragic
95.2%
Costa Ricans
3.0
/100
|
#234
Tragic
95.2%
Nigerians
2.9
/100
|
#235
Tragic
95.2%
Senegalese
2.7
/100
|
#236
Tragic
95.2%
Immigrants | Africa
2.7
/100
|
#237
Tragic
95.2%
Natives/Alaskans
2.3
/100
|
#238
Tragic
95.2%
Immigrants | Sierra Leone
2.1
/100
|
#239
Tragic
95.1%
Ethiopians
2.0
/100
|
#240
Tragic
95.1%
South American Indians
1.9
/100
|
#241
Tragic
95.1%
Tongans
1.7
/100
|
#242
Tragic
95.1%
Paiute
1.7
/100
|
#243
Tragic
95.1%
Immigrants | Middle Africa
1.7
/100
|
#244
Tragic
95.1%
Jamaicans
1.4
/100
|
#245
Tragic
95.1%
Somalis
1.4
/100
|
#246
Tragic
95.1%
Immigrants | Senegal
1.4
/100
|
#247
Tragic
95.1%