Polish vs Tsimshian Disability Age 35 to 64
COMPARE
Polish
Tsimshian
Disability Age 35 to 64
Disability Age 35 to 64 Comparison
Poles
Tsimshian
11.3%
DISABILITY AGE 35 TO 64
42.0/ 100
METRIC RATING
178th/ 347
METRIC RANK
16.7%
DISABILITY AGE 35 TO 64
0.0/ 100
METRIC RATING
341st/ 347
METRIC RANK
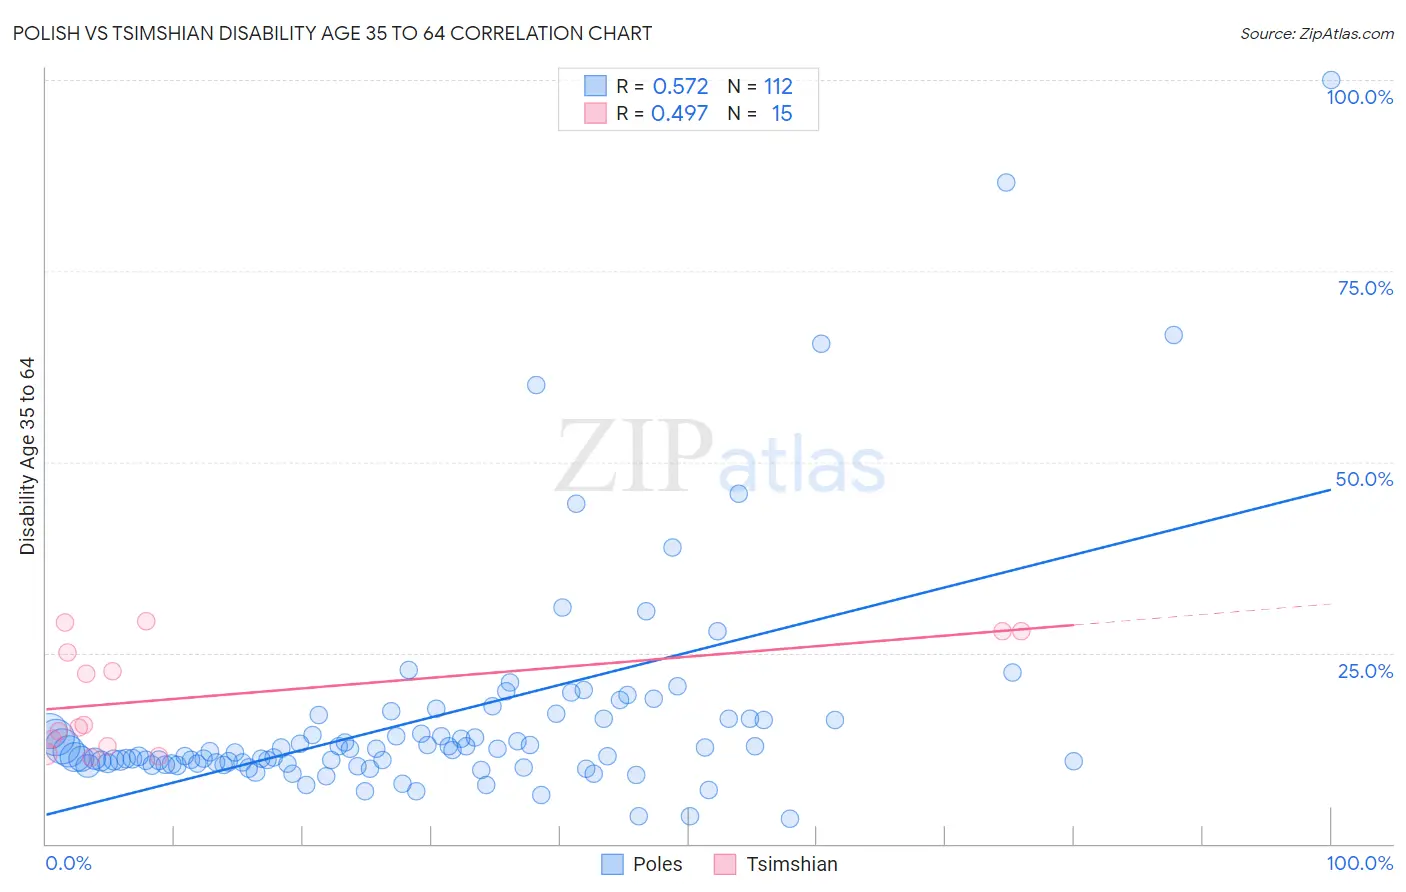
Polish vs Tsimshian Disability Age 35 to 64 Correlation Chart
The statistical analysis conducted on geographies consisting of 559,533,699 people shows a substantial positive correlation between the proportion of Poles and percentage of population with a disability between the ages 34 and 64 in the United States with a correlation coefficient (R) of 0.572 and weighted average of 11.3%. Similarly, the statistical analysis conducted on geographies consisting of 15,626,462 people shows a moderate positive correlation between the proportion of Tsimshian and percentage of population with a disability between the ages 34 and 64 in the United States with a correlation coefficient (R) of 0.497 and weighted average of 16.7%, a difference of 47.4%.
Disability Age 35 to 64 Correlation Summary
| Measurement | Polish | Tsimshian |
| Minimum | 3.3% | 11.4% |
| Maximum | 100.0% | 29.2% |
| Range | 96.7% | 17.8% |
| Mean | 16.5% | 19.4% |
| Median | 12.0% | 15.6% |
| Interquartile 25% (IQ1) | 10.5% | 12.8% |
| Interquartile 75% (IQ3) | 16.4% | 27.9% |
| Interquartile Range (IQR) | 5.9% | 15.1% |
| Standard Deviation (Sample) | 14.9% | 7.1% |
| Standard Deviation (Population) | 14.8% | 6.8% |
Similar Demographics by Disability Age 35 to 64
Demographics Similar to Poles by Disability Age 35 to 64
In terms of disability age 35 to 64, the demographic groups most similar to Poles are Immigrants from Eastern Africa (11.3%, a difference of 0.020%), Immigrants from Barbados (11.3%, a difference of 0.040%), Immigrants from Caribbean (11.3%, a difference of 0.040%), Trinidadian and Tobagonian (11.4%, a difference of 0.10%), and Ugandan (11.3%, a difference of 0.14%).
| Demographics | Rating | Rank | Disability Age 35 to 64 |
| Immigrants | Trinidad and Tobago | 55.9 /100 | #171 | Average 11.2% |
| Italians | 55.6 /100 | #172 | Average 11.2% |
| Lebanese | 51.8 /100 | #173 | Average 11.3% |
| Immigrants | Fiji | 50.0 /100 | #174 | Average 11.3% |
| Czechs | 47.9 /100 | #175 | Average 11.3% |
| Ugandans | 43.7 /100 | #176 | Average 11.3% |
| Immigrants | Eastern Africa | 42.2 /100 | #177 | Average 11.3% |
| Poles | 42.0 /100 | #178 | Average 11.3% |
| Immigrants | Barbados | 41.6 /100 | #179 | Average 11.3% |
| Immigrants | Caribbean | 41.5 /100 | #180 | Average 11.3% |
| Trinidadians and Tobagonians | 40.8 /100 | #181 | Average 11.4% |
| Icelanders | 39.7 /100 | #182 | Fair 11.4% |
| Immigrants | Oceania | 39.5 /100 | #183 | Fair 11.4% |
| Kenyans | 39.2 /100 | #184 | Fair 11.4% |
| Danes | 36.8 /100 | #185 | Fair 11.4% |
Demographics Similar to Tsimshian by Disability Age 35 to 64
In terms of disability age 35 to 64, the demographic groups most similar to Tsimshian are Tohono O'odham (16.7%, a difference of 0.11%), Creek (16.9%, a difference of 0.97%), Yup'ik (16.9%, a difference of 1.3%), Choctaw (16.4%, a difference of 1.9%), and Pima (16.1%, a difference of 3.6%).
| Demographics | Rating | Rank | Disability Age 35 to 64 |
| Yuman | 0.0 /100 | #333 | Tragic 15.8% |
| Colville | 0.0 /100 | #334 | Tragic 15.8% |
| Seminole | 0.0 /100 | #335 | Tragic 15.9% |
| Menominee | 0.0 /100 | #336 | Tragic 15.9% |
| Puerto Ricans | 0.0 /100 | #337 | Tragic 15.9% |
| Chickasaw | 0.0 /100 | #338 | Tragic 16.1% |
| Pima | 0.0 /100 | #339 | Tragic 16.1% |
| Choctaw | 0.0 /100 | #340 | Tragic 16.4% |
| Tsimshian | 0.0 /100 | #341 | Tragic 16.7% |
| Tohono O'odham | 0.0 /100 | #342 | Tragic 16.7% |
| Creek | 0.0 /100 | #343 | Tragic 16.9% |
| Yup'ik | 0.0 /100 | #344 | Tragic 16.9% |
| Kiowa | 0.0 /100 | #345 | Tragic 17.4% |
| Lumbee | 0.0 /100 | #346 | Tragic 17.6% |
| Houma | 0.0 /100 | #347 | Tragic 18.7% |