Polish vs Tsimshian Disability Age 18 to 34
COMPARE
Polish
Tsimshian
Disability Age 18 to 34
Disability Age 18 to 34 Comparison
Poles
Tsimshian
7.2%
DISABILITY AGE 18 TO 34
0.6/ 100
METRIC RATING
252nd/ 347
METRIC RANK
7.4%
DISABILITY AGE 18 TO 34
0.1/ 100
METRIC RATING
272nd/ 347
METRIC RANK
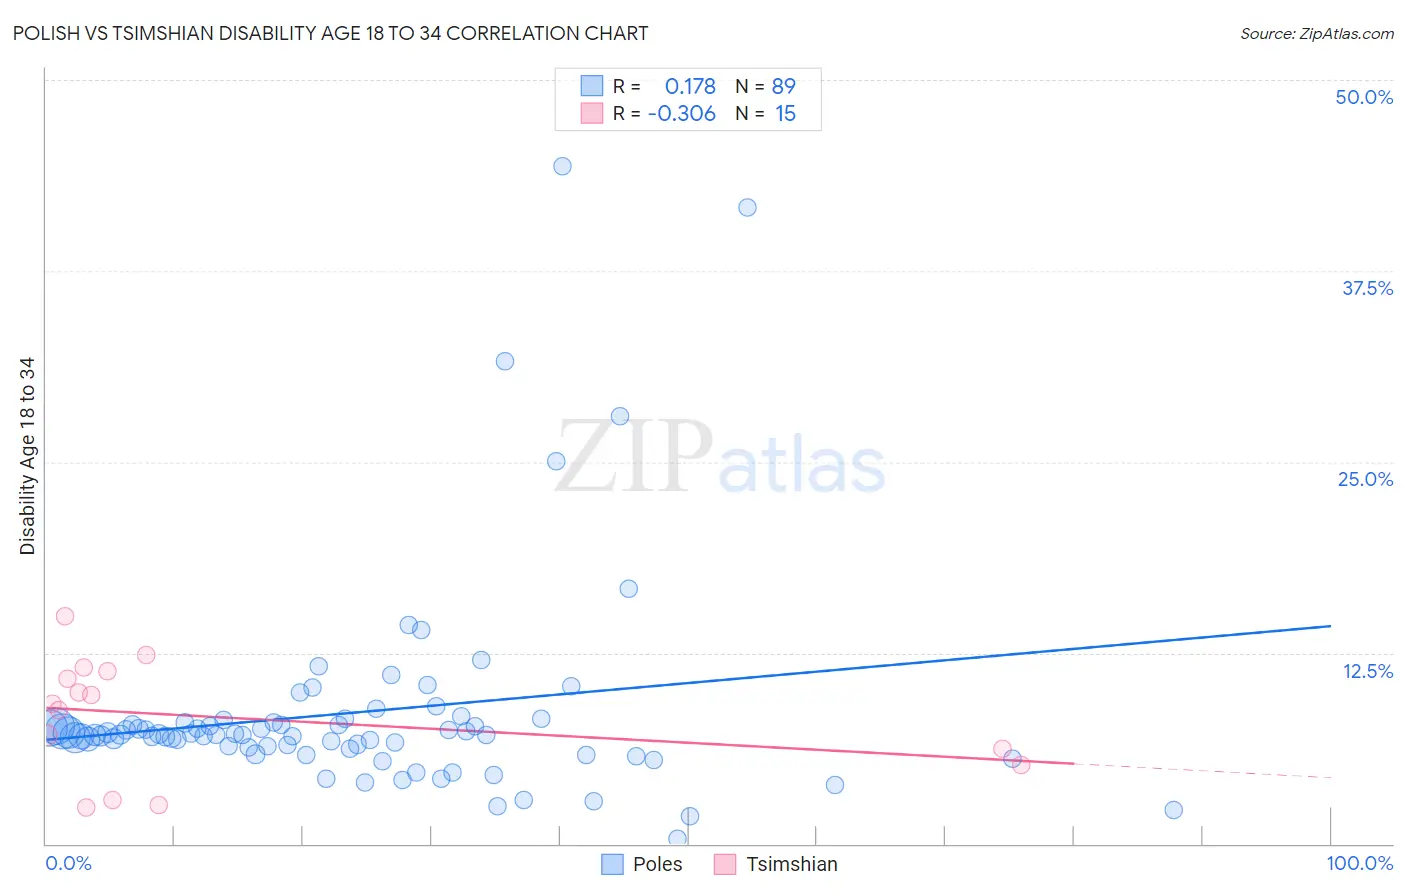
Polish vs Tsimshian Disability Age 18 to 34 Correlation Chart
The statistical analysis conducted on geographies consisting of 555,253,570 people shows a poor positive correlation between the proportion of Poles and percentage of population with a disability between the ages 18 and 35 in the United States with a correlation coefficient (R) of 0.178 and weighted average of 7.2%. Similarly, the statistical analysis conducted on geographies consisting of 15,623,227 people shows a mild negative correlation between the proportion of Tsimshian and percentage of population with a disability between the ages 18 and 35 in the United States with a correlation coefficient (R) of -0.306 and weighted average of 7.4%, a difference of 2.8%.
Disability Age 18 to 34 Correlation Summary
| Measurement | Polish | Tsimshian |
| Minimum | 0.32% | 2.4% |
| Maximum | 44.4% | 14.9% |
| Range | 44.1% | 12.4% |
| Mean | 8.6% | 8.3% |
| Median | 7.1% | 9.1% |
| Interquartile 25% (IQ1) | 6.2% | 5.2% |
| Interquartile 75% (IQ3) | 7.9% | 11.3% |
| Interquartile Range (IQR) | 1.7% | 6.1% |
| Standard Deviation (Sample) | 7.0% | 3.8% |
| Standard Deviation (Population) | 6.9% | 3.7% |
Demographics Similar to Poles and Tsimshian by Disability Age 18 to 34
In terms of disability age 18 to 34, the demographic groups most similar to Poles are Croatian (7.2%, a difference of 0.27%), Indonesian (7.2%, a difference of 0.55%), Immigrants from Germany (7.2%, a difference of 0.57%), Immigrants from Laos (7.2%, a difference of 0.61%), and Czech (7.2%, a difference of 0.87%). Similarly, the demographic groups most similar to Tsimshian are Swiss (7.4%, a difference of 0.090%), Belgian (7.4%, a difference of 0.14%), Basque (7.4%, a difference of 0.23%), Portuguese (7.4%, a difference of 0.27%), and Bangladeshi (7.4%, a difference of 0.35%).
| Demographics | Rating | Rank | Disability Age 18 to 34 |
| Poles | 0.6 /100 | #252 | Tragic 7.2% |
| Croatians | 0.5 /100 | #253 | Tragic 7.2% |
| Indonesians | 0.4 /100 | #254 | Tragic 7.2% |
| Immigrants | Germany | 0.4 /100 | #255 | Tragic 7.2% |
| Immigrants | Laos | 0.4 /100 | #256 | Tragic 7.2% |
| Czechs | 0.3 /100 | #257 | Tragic 7.2% |
| Immigrants | Micronesia | 0.3 /100 | #258 | Tragic 7.3% |
| Somalis | 0.2 /100 | #259 | Tragic 7.3% |
| Tohono O'odham | 0.2 /100 | #260 | Tragic 7.3% |
| Northern Europeans | 0.2 /100 | #261 | Tragic 7.3% |
| Canadians | 0.2 /100 | #262 | Tragic 7.3% |
| British | 0.2 /100 | #263 | Tragic 7.3% |
| Bermudans | 0.1 /100 | #264 | Tragic 7.3% |
| Slovenes | 0.1 /100 | #265 | Tragic 7.3% |
| German Russians | 0.1 /100 | #266 | Tragic 7.4% |
| Bangladeshis | 0.1 /100 | #267 | Tragic 7.4% |
| Portuguese | 0.1 /100 | #268 | Tragic 7.4% |
| Basques | 0.1 /100 | #269 | Tragic 7.4% |
| Belgians | 0.1 /100 | #270 | Tragic 7.4% |
| Swiss | 0.1 /100 | #271 | Tragic 7.4% |
| Tsimshian | 0.1 /100 | #272 | Tragic 7.4% |