Polish vs Hungarian Disability Age 35 to 64
COMPARE
Polish
Hungarian
Disability Age 35 to 64
Disability Age 35 to 64 Comparison
Poles
Hungarians
11.3%
DISABILITY AGE 35 TO 64
42.0/ 100
METRIC RATING
178th/ 347
METRIC RANK
11.4%
DISABILITY AGE 35 TO 64
34.6/ 100
METRIC RATING
189th/ 347
METRIC RANK
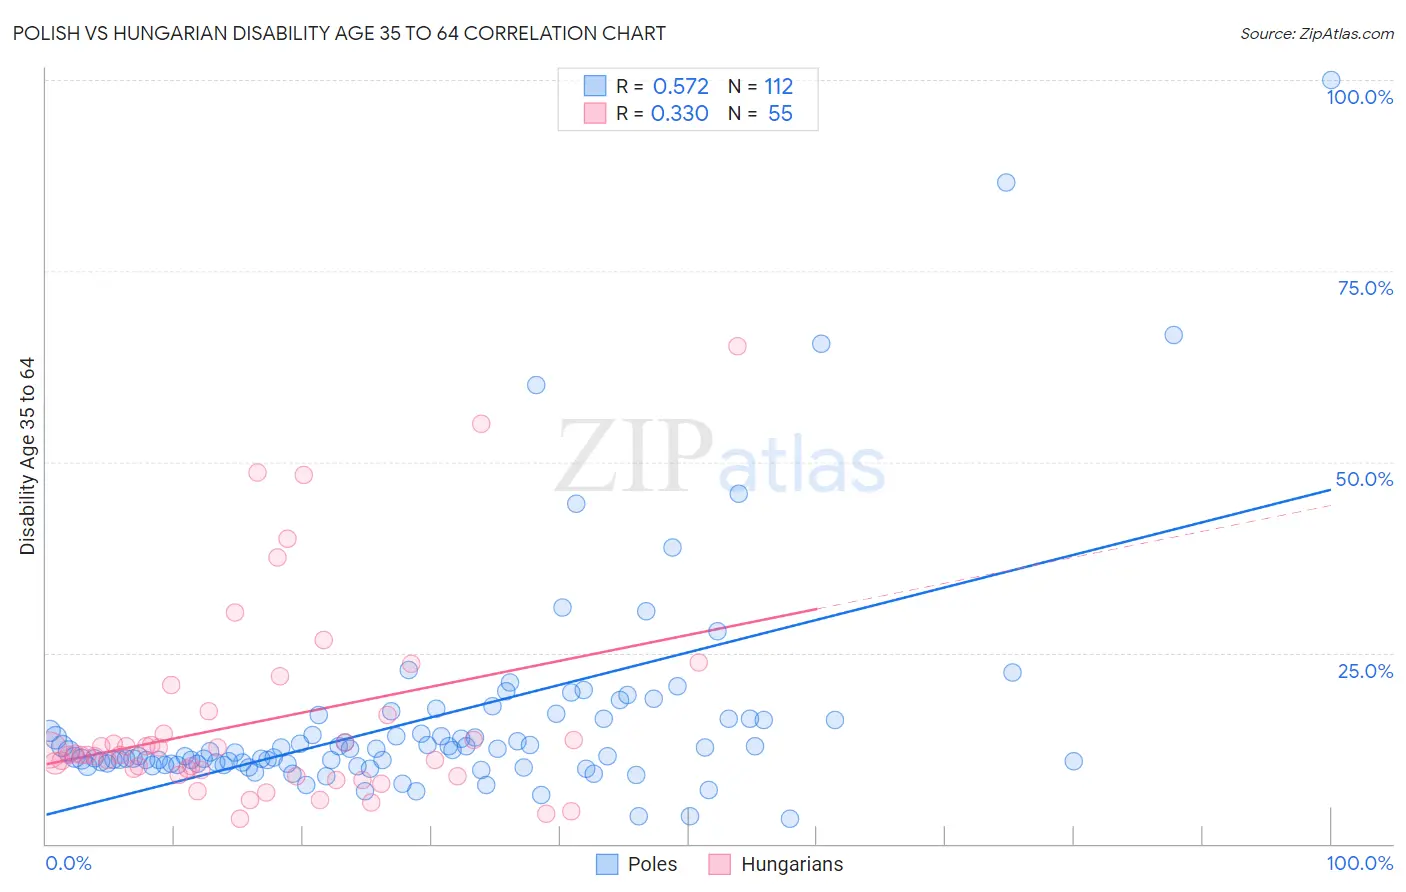
Polish vs Hungarian Disability Age 35 to 64 Correlation Chart
The statistical analysis conducted on geographies consisting of 559,533,699 people shows a substantial positive correlation between the proportion of Poles and percentage of population with a disability between the ages 34 and 64 in the United States with a correlation coefficient (R) of 0.572 and weighted average of 11.3%. Similarly, the statistical analysis conducted on geographies consisting of 485,731,393 people shows a mild positive correlation between the proportion of Hungarians and percentage of population with a disability between the ages 34 and 64 in the United States with a correlation coefficient (R) of 0.330 and weighted average of 11.4%, a difference of 0.62%.
Disability Age 35 to 64 Correlation Summary
| Measurement | Polish | Hungarian |
| Minimum | 3.3% | 3.3% |
| Maximum | 100.0% | 65.2% |
| Range | 96.7% | 61.9% |
| Mean | 16.5% | 16.1% |
| Median | 12.0% | 11.7% |
| Interquartile 25% (IQ1) | 10.5% | 9.0% |
| Interquartile 75% (IQ3) | 16.4% | 16.9% |
| Interquartile Range (IQR) | 5.9% | 7.9% |
| Standard Deviation (Sample) | 14.9% | 13.2% |
| Standard Deviation (Population) | 14.8% | 13.0% |
Demographics Similar to Poles and Hungarians by Disability Age 35 to 64
In terms of disability age 35 to 64, the demographic groups most similar to Poles are Immigrants from Eastern Africa (11.3%, a difference of 0.020%), Immigrants from Barbados (11.3%, a difference of 0.040%), Immigrants from Caribbean (11.3%, a difference of 0.040%), Trinidadian and Tobagonian (11.4%, a difference of 0.10%), and Ugandan (11.3%, a difference of 0.14%). Similarly, the demographic groups most similar to Hungarians are Northern European (11.4%, a difference of 0.020%), Immigrants from Bosnia and Herzegovina (11.4%, a difference of 0.050%), Slovene (11.4%, a difference of 0.17%), Danish (11.4%, a difference of 0.19%), and Immigrants from Nigeria (11.4%, a difference of 0.19%).
| Demographics | Rating | Rank | Disability Age 35 to 64 |
| Lebanese | 51.8 /100 | #173 | Average 11.3% |
| Immigrants | Fiji | 50.0 /100 | #174 | Average 11.3% |
| Czechs | 47.9 /100 | #175 | Average 11.3% |
| Ugandans | 43.7 /100 | #176 | Average 11.3% |
| Immigrants | Eastern Africa | 42.2 /100 | #177 | Average 11.3% |
| Poles | 42.0 /100 | #178 | Average 11.3% |
| Immigrants | Barbados | 41.6 /100 | #179 | Average 11.3% |
| Immigrants | Caribbean | 41.5 /100 | #180 | Average 11.3% |
| Trinidadians and Tobagonians | 40.8 /100 | #181 | Average 11.4% |
| Icelanders | 39.7 /100 | #182 | Fair 11.4% |
| Immigrants | Oceania | 39.5 /100 | #183 | Fair 11.4% |
| Kenyans | 39.2 /100 | #184 | Fair 11.4% |
| Danes | 36.8 /100 | #185 | Fair 11.4% |
| Slovenes | 36.6 /100 | #186 | Fair 11.4% |
| Immigrants | Bosnia and Herzegovina | 35.2 /100 | #187 | Fair 11.4% |
| Northern Europeans | 34.9 /100 | #188 | Fair 11.4% |
| Hungarians | 34.6 /100 | #189 | Fair 11.4% |
| Immigrants | Nigeria | 32.5 /100 | #190 | Fair 11.4% |
| Swedes | 31.3 /100 | #191 | Fair 11.4% |
| Norwegians | 29.7 /100 | #192 | Fair 11.5% |
| Immigrants | Africa | 29.0 /100 | #193 | Fair 11.5% |