Polish vs Tsimshian Householder Income Ages 25 - 44 years
COMPARE
Polish
Tsimshian
Householder Income Ages 25 - 44 years
Householder Income Ages 25 - 44 years Comparison
Poles
Tsimshian
$99,685
HOUSEHOLDER INCOME AGES 25 - 44 YEARS
94.5/ 100
METRIC RATING
112th/ 347
METRIC RANK
$97,809
HOUSEHOLDER INCOME AGES 25 - 44 YEARS
85.8/ 100
METRIC RATING
133rd/ 347
METRIC RANK
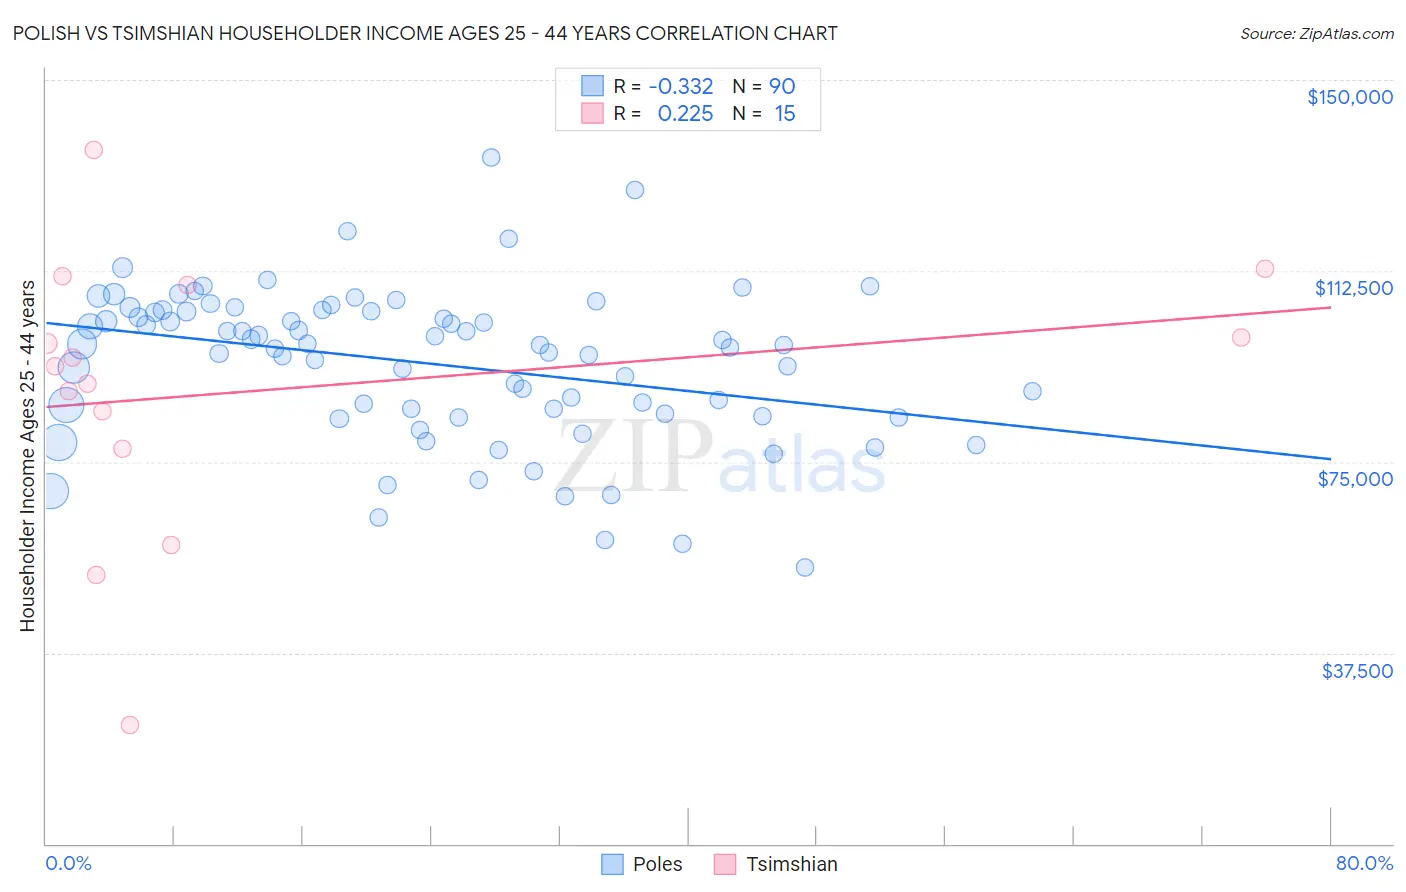
Polish vs Tsimshian Householder Income Ages 25 - 44 years Correlation Chart
The statistical analysis conducted on geographies consisting of 555,649,021 people shows a mild negative correlation between the proportion of Poles and household income with householder between the ages 25 and 44 in the United States with a correlation coefficient (R) of -0.332 and weighted average of $99,685. Similarly, the statistical analysis conducted on geographies consisting of 15,621,525 people shows a weak positive correlation between the proportion of Tsimshian and household income with householder between the ages 25 and 44 in the United States with a correlation coefficient (R) of 0.225 and weighted average of $97,809, a difference of 1.9%.
Householder Income Ages 25 - 44 years Correlation Summary
| Measurement | Polish | Tsimshian |
| Minimum | $54,279 | $23,438 |
| Maximum | $134,668 | $136,250 |
| Range | $80,389 | $112,812 |
| Mean | $94,388 | $88,925 |
| Median | $97,963 | $93,749 |
| Interquartile 25% (IQ1) | $84,559 | $77,546 |
| Interquartile 75% (IQ3) | $104,554 | $109,750 |
| Interquartile Range (IQR) | $19,995 | $32,204 |
| Standard Deviation (Sample) | $15,033 | $27,608 |
| Standard Deviation (Population) | $14,949 | $26,672 |
Similar Demographics by Householder Income Ages 25 - 44 years
Demographics Similar to Poles by Householder Income Ages 25 - 44 years
In terms of householder income ages 25 - 44 years, the demographic groups most similar to Poles are Tongan ($99,604, a difference of 0.080%), Immigrants from Western Asia ($99,516, a difference of 0.17%), Chilean ($99,900, a difference of 0.22%), Carpatho Rusyn ($99,449, a difference of 0.24%), and Portuguese ($99,429, a difference of 0.26%).
| Demographics | Rating | Rank | Householder Income Ages 25 - 44 years |
| Immigrants | Vietnam | 96.5 /100 | #105 | Exceptional $100,535 |
| Immigrants | Brazil | 96.5 /100 | #106 | Exceptional $100,534 |
| Northern Europeans | 96.3 /100 | #107 | Exceptional $100,457 |
| Immigrants | South Eastern Asia | 96.0 /100 | #108 | Exceptional $100,283 |
| Immigrants | North Macedonia | 95.6 /100 | #109 | Exceptional $100,101 |
| Immigrants | Afghanistan | 95.3 /100 | #110 | Exceptional $99,977 |
| Chileans | 95.1 /100 | #111 | Exceptional $99,900 |
| Poles | 94.5 /100 | #112 | Exceptional $99,685 |
| Tongans | 94.2 /100 | #113 | Exceptional $99,604 |
| Immigrants | Western Asia | 94.0 /100 | #114 | Exceptional $99,516 |
| Carpatho Rusyns | 93.7 /100 | #115 | Exceptional $99,449 |
| Portuguese | 93.7 /100 | #116 | Exceptional $99,429 |
| Immigrants | Northern Africa | 93.0 /100 | #117 | Exceptional $99,232 |
| Syrians | 92.9 /100 | #118 | Exceptional $99,215 |
| Jordanians | 92.8 /100 | #119 | Exceptional $99,186 |
Demographics Similar to Tsimshian by Householder Income Ages 25 - 44 years
In terms of householder income ages 25 - 44 years, the demographic groups most similar to Tsimshian are Immigrants from Zimbabwe ($97,880, a difference of 0.070%), Immigrants from Albania ($97,929, a difference of 0.12%), Canadian ($97,625, a difference of 0.19%), Immigrants from Oceania ($97,623, a difference of 0.19%), and Hungarian ($97,544, a difference of 0.27%).
| Demographics | Rating | Rank | Householder Income Ages 25 - 44 years |
| British | 89.1 /100 | #126 | Excellent $98,359 |
| Serbians | 88.9 /100 | #127 | Excellent $98,320 |
| Europeans | 88.9 /100 | #128 | Excellent $98,310 |
| Brazilians | 88.6 /100 | #129 | Excellent $98,267 |
| Immigrants | Kuwait | 87.8 /100 | #130 | Excellent $98,122 |
| Immigrants | Albania | 86.6 /100 | #131 | Excellent $97,929 |
| Immigrants | Zimbabwe | 86.3 /100 | #132 | Excellent $97,880 |
| Tsimshian | 85.8 /100 | #133 | Excellent $97,809 |
| Canadians | 84.5 /100 | #134 | Excellent $97,625 |
| Immigrants | Oceania | 84.5 /100 | #135 | Excellent $97,623 |
| Hungarians | 83.9 /100 | #136 | Excellent $97,544 |
| Lebanese | 82.3 /100 | #137 | Excellent $97,339 |
| Arabs | 82.3 /100 | #138 | Excellent $97,336 |
| Immigrants | Peru | 82.2 /100 | #139 | Excellent $97,329 |
| Immigrants | Morocco | 82.0 /100 | #140 | Excellent $97,305 |