Polish vs Immigrants from Ecuador Self-Care Disability
COMPARE
Polish
Immigrants from Ecuador
Self-Care Disability
Self-Care Disability Comparison
Poles
Immigrants from Ecuador
2.4%
SELF-CARE DISABILITY
88.9/ 100
METRIC RATING
131st/ 347
METRIC RANK
2.6%
SELF-CARE DISABILITY
2.5/ 100
METRIC RATING
230th/ 347
METRIC RANK
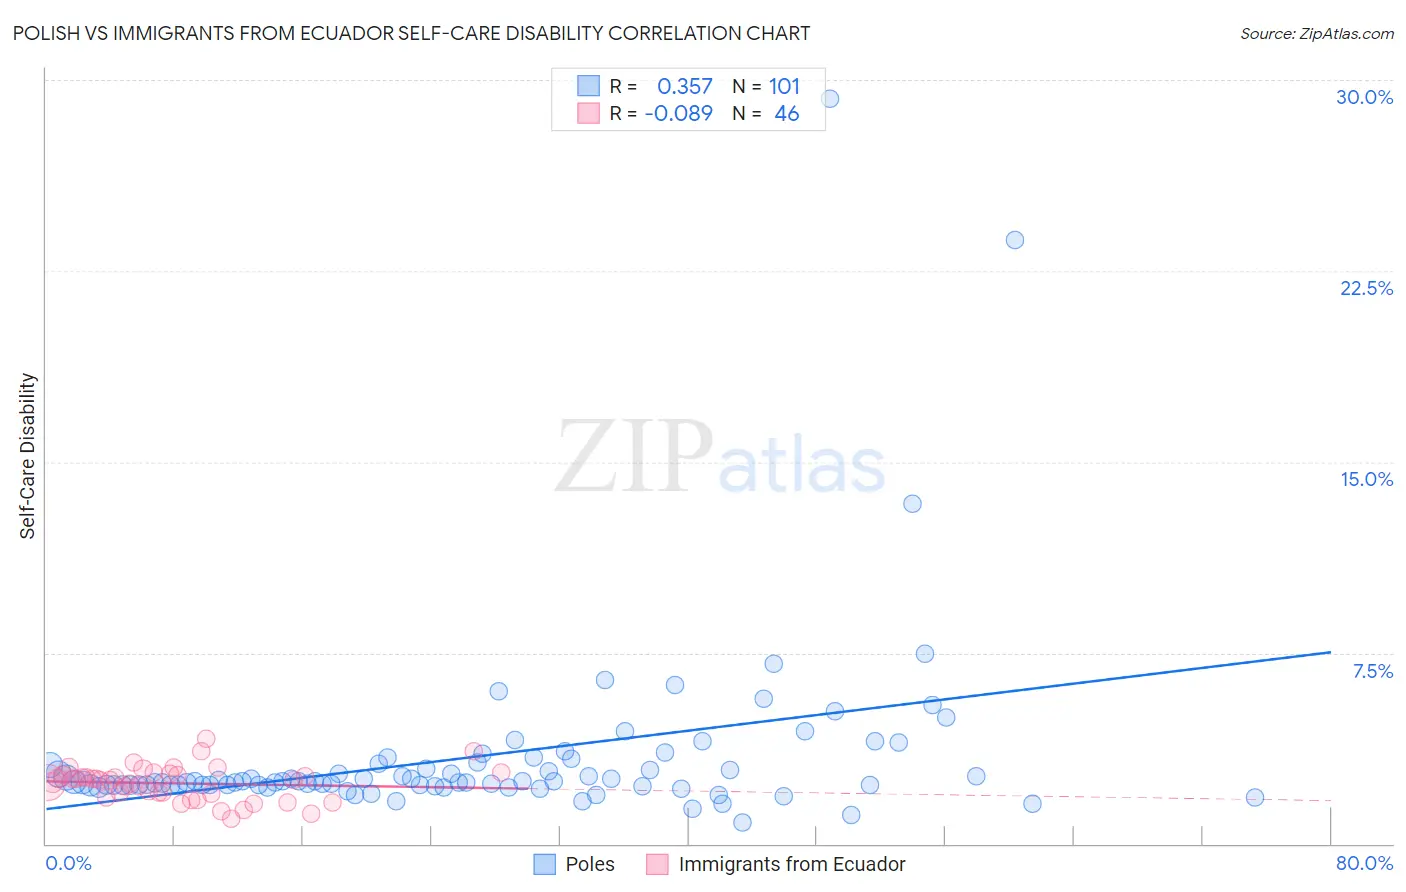
Polish vs Immigrants from Ecuador Self-Care Disability Correlation Chart
The statistical analysis conducted on geographies consisting of 558,400,698 people shows a mild positive correlation between the proportion of Poles and percentage of population with self-care disability in the United States with a correlation coefficient (R) of 0.357 and weighted average of 2.4%. Similarly, the statistical analysis conducted on geographies consisting of 270,835,557 people shows a slight negative correlation between the proportion of Immigrants from Ecuador and percentage of population with self-care disability in the United States with a correlation coefficient (R) of -0.089 and weighted average of 2.6%, a difference of 7.0%.
Self-Care Disability Correlation Summary
| Measurement | Polish | Immigrants from Ecuador |
| Minimum | 0.81% | 0.96% |
| Maximum | 29.3% | 4.1% |
| Range | 28.5% | 3.1% |
| Mean | 3.4% | 2.4% |
| Median | 2.4% | 2.5% |
| Interquartile 25% (IQ1) | 2.3% | 2.0% |
| Interquartile 75% (IQ3) | 3.2% | 2.7% |
| Interquartile Range (IQR) | 0.88% | 0.76% |
| Standard Deviation (Sample) | 3.7% | 0.66% |
| Standard Deviation (Population) | 3.7% | 0.65% |
Similar Demographics by Self-Care Disability
Demographics Similar to Poles by Self-Care Disability
In terms of self-care disability, the demographic groups most similar to Poles are Immigrants from South America (2.4%, a difference of 0.010%), Immigrants from Austria (2.4%, a difference of 0.020%), Immigrants from Colombia (2.4%, a difference of 0.040%), Immigrants from Romania (2.4%, a difference of 0.050%), and Russian (2.4%, a difference of 0.080%).
| Demographics | Rating | Rank | Self-Care Disability |
| Immigrants | North America | 90.2 /100 | #124 | Exceptional 2.4% |
| Immigrants | Morocco | 90.2 /100 | #124 | Exceptional 2.4% |
| Hmong | 89.9 /100 | #126 | Excellent 2.4% |
| Colombians | 89.7 /100 | #127 | Excellent 2.4% |
| Immigrants | Hungary | 89.6 /100 | #128 | Excellent 2.4% |
| Immigrants | Romania | 89.3 /100 | #129 | Excellent 2.4% |
| Immigrants | Austria | 89.0 /100 | #130 | Excellent 2.4% |
| Poles | 88.9 /100 | #131 | Excellent 2.4% |
| Immigrants | South America | 88.8 /100 | #132 | Excellent 2.4% |
| Immigrants | Colombia | 88.5 /100 | #133 | Excellent 2.4% |
| Russians | 88.2 /100 | #134 | Excellent 2.4% |
| Laotians | 87.8 /100 | #135 | Excellent 2.4% |
| South American Indians | 87.2 /100 | #136 | Excellent 2.4% |
| Austrians | 87.0 /100 | #137 | Excellent 2.4% |
| Immigrants | Croatia | 86.6 /100 | #138 | Excellent 2.4% |
Demographics Similar to Immigrants from Ecuador by Self-Care Disability
In terms of self-care disability, the demographic groups most similar to Immigrants from Ecuador are Guamanian/Chamorro (2.6%, a difference of 0.010%), Immigrants from Philippines (2.6%, a difference of 0.080%), Guatemalan (2.6%, a difference of 0.080%), Immigrants from Guatemala (2.6%, a difference of 0.15%), and Chinese (2.6%, a difference of 0.16%).
| Demographics | Rating | Rank | Self-Care Disability |
| French Canadians | 3.8 /100 | #223 | Tragic 2.6% |
| Osage | 3.6 /100 | #224 | Tragic 2.6% |
| Iraqis | 3.2 /100 | #225 | Tragic 2.6% |
| Chinese | 2.9 /100 | #226 | Tragic 2.6% |
| Immigrants | Philippines | 2.7 /100 | #227 | Tragic 2.6% |
| Guatemalans | 2.7 /100 | #228 | Tragic 2.6% |
| Guamanians/Chamorros | 2.5 /100 | #229 | Tragic 2.6% |
| Immigrants | Ecuador | 2.5 /100 | #230 | Tragic 2.6% |
| Immigrants | Guatemala | 2.2 /100 | #231 | Tragic 2.6% |
| Albanians | 2.2 /100 | #232 | Tragic 2.6% |
| Liberians | 2.1 /100 | #233 | Tragic 2.6% |
| Vietnamese | 2.1 /100 | #234 | Tragic 2.6% |
| Bahamians | 2.0 /100 | #235 | Tragic 2.6% |
| Bermudans | 1.9 /100 | #236 | Tragic 2.6% |
| Immigrants | Senegal | 1.6 /100 | #237 | Tragic 2.6% |