Polish vs Immigrants from Ecuador Receiving Food Stamps
COMPARE
Polish
Immigrants from Ecuador
Receiving Food Stamps
Receiving Food Stamps Comparison
Poles
Immigrants from Ecuador
10.0%
RECEIVING FOOD STAMPS
98.6/ 100
METRIC RATING
80th/ 347
METRIC RANK
15.0%
RECEIVING FOOD STAMPS
0.0/ 100
METRIC RATING
284th/ 347
METRIC RANK
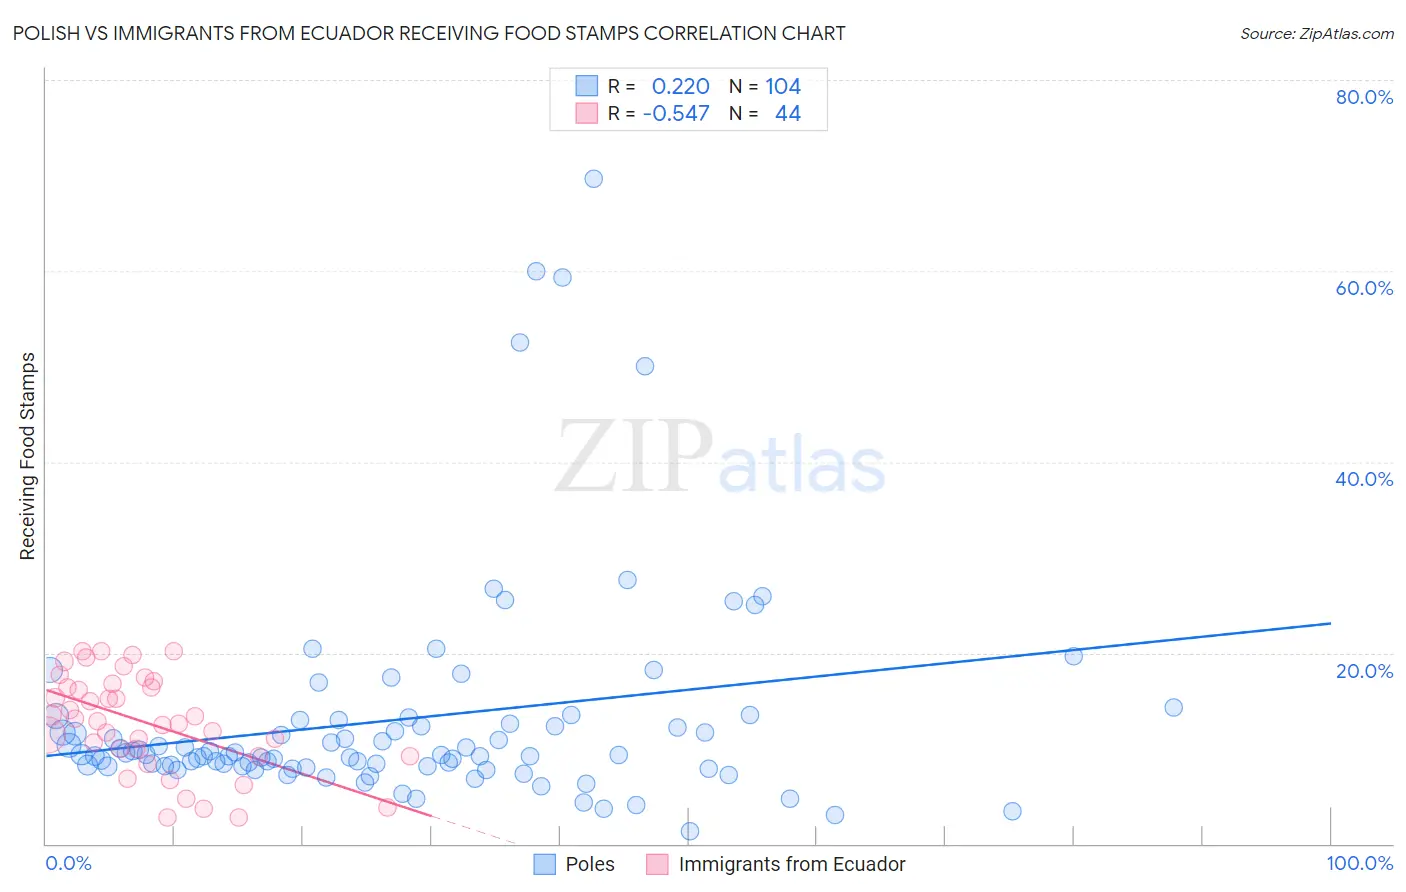
Polish vs Immigrants from Ecuador Receiving Food Stamps Correlation Chart
The statistical analysis conducted on geographies consisting of 556,985,146 people shows a weak positive correlation between the proportion of Poles and percentage of population receiving government assistance and/or food stamps in the United States with a correlation coefficient (R) of 0.220 and weighted average of 10.0%. Similarly, the statistical analysis conducted on geographies consisting of 270,373,002 people shows a substantial negative correlation between the proportion of Immigrants from Ecuador and percentage of population receiving government assistance and/or food stamps in the United States with a correlation coefficient (R) of -0.547 and weighted average of 15.0%, a difference of 50.8%.
Receiving Food Stamps Correlation Summary
| Measurement | Polish | Immigrants from Ecuador |
| Minimum | 1.3% | 2.8% |
| Maximum | 69.7% | 20.2% |
| Range | 68.4% | 17.4% |
| Mean | 13.0% | 12.7% |
| Median | 9.3% | 13.0% |
| Interquartile 25% (IQ1) | 8.1% | 9.5% |
| Interquartile 75% (IQ3) | 12.7% | 16.6% |
| Interquartile Range (IQR) | 4.6% | 7.0% |
| Standard Deviation (Sample) | 11.6% | 5.0% |
| Standard Deviation (Population) | 11.5% | 5.0% |
Similar Demographics by Receiving Food Stamps
Demographics Similar to Poles by Receiving Food Stamps
In terms of receiving food stamps, the demographic groups most similar to Poles are Laotian (10.0%, a difference of 0.080%), South African (10.0%, a difference of 0.12%), Immigrants from England (10.0%, a difference of 0.14%), Immigrants from North Macedonia (10.0%, a difference of 0.16%), and Immigrants from Croatia (10.0%, a difference of 0.25%).
| Demographics | Rating | Rank | Receiving Food Stamps |
| Macedonians | 98.9 /100 | #73 | Exceptional 9.9% |
| New Zealanders | 98.8 /100 | #74 | Exceptional 9.9% |
| Immigrants | Zimbabwe | 98.7 /100 | #75 | Exceptional 9.9% |
| Immigrants | Croatia | 98.7 /100 | #76 | Exceptional 10.0% |
| Immigrants | North Macedonia | 98.7 /100 | #77 | Exceptional 10.0% |
| South Africans | 98.7 /100 | #78 | Exceptional 10.0% |
| Laotians | 98.7 /100 | #79 | Exceptional 10.0% |
| Poles | 98.6 /100 | #80 | Exceptional 10.0% |
| Immigrants | England | 98.6 /100 | #81 | Exceptional 10.0% |
| Austrians | 98.6 /100 | #82 | Exceptional 10.0% |
| Dutch | 98.6 /100 | #83 | Exceptional 10.0% |
| Immigrants | Israel | 98.5 /100 | #84 | Exceptional 10.0% |
| Immigrants | Romania | 98.5 /100 | #85 | Exceptional 10.0% |
| Immigrants | Norway | 98.4 /100 | #86 | Exceptional 10.0% |
| Egyptians | 98.4 /100 | #87 | Exceptional 10.0% |
Demographics Similar to Immigrants from Ecuador by Receiving Food Stamps
In terms of receiving food stamps, the demographic groups most similar to Immigrants from Ecuador are Bangladeshi (15.0%, a difference of 0.010%), Immigrants from Central America (15.0%, a difference of 0.29%), Immigrants from Liberia (15.1%, a difference of 0.38%), African (15.1%, a difference of 0.52%), and Immigrants from Mexico (15.2%, a difference of 0.75%).
| Demographics | Rating | Rank | Receiving Food Stamps |
| Seminole | 0.1 /100 | #277 | Tragic 14.8% |
| Belizeans | 0.1 /100 | #278 | Tragic 14.8% |
| Kiowa | 0.0 /100 | #279 | Tragic 14.9% |
| Ecuadorians | 0.0 /100 | #280 | Tragic 14.9% |
| Spanish American Indians | 0.0 /100 | #281 | Tragic 14.9% |
| Immigrants | Central America | 0.0 /100 | #282 | Tragic 15.0% |
| Bangladeshis | 0.0 /100 | #283 | Tragic 15.0% |
| Immigrants | Ecuador | 0.0 /100 | #284 | Tragic 15.0% |
| Immigrants | Liberia | 0.0 /100 | #285 | Tragic 15.1% |
| Africans | 0.0 /100 | #286 | Tragic 15.1% |
| Immigrants | Mexico | 0.0 /100 | #287 | Tragic 15.2% |
| Immigrants | Belize | 0.0 /100 | #288 | Tragic 15.2% |
| Immigrants | Senegal | 0.0 /100 | #289 | Tragic 15.3% |
| Senegalese | 0.0 /100 | #290 | Tragic 15.4% |
| Hondurans | 0.0 /100 | #291 | Tragic 15.5% |