Polish vs Immigrants from the Azores Self-Care Disability
COMPARE
Polish
Immigrants from the Azores
Self-Care Disability
Self-Care Disability Comparison
Poles
Immigrants from the Azores
2.4%
SELF-CARE DISABILITY
88.9/ 100
METRIC RATING
131st/ 347
METRIC RANK
3.0%
SELF-CARE DISABILITY
0.0/ 100
METRIC RATING
335th/ 347
METRIC RANK
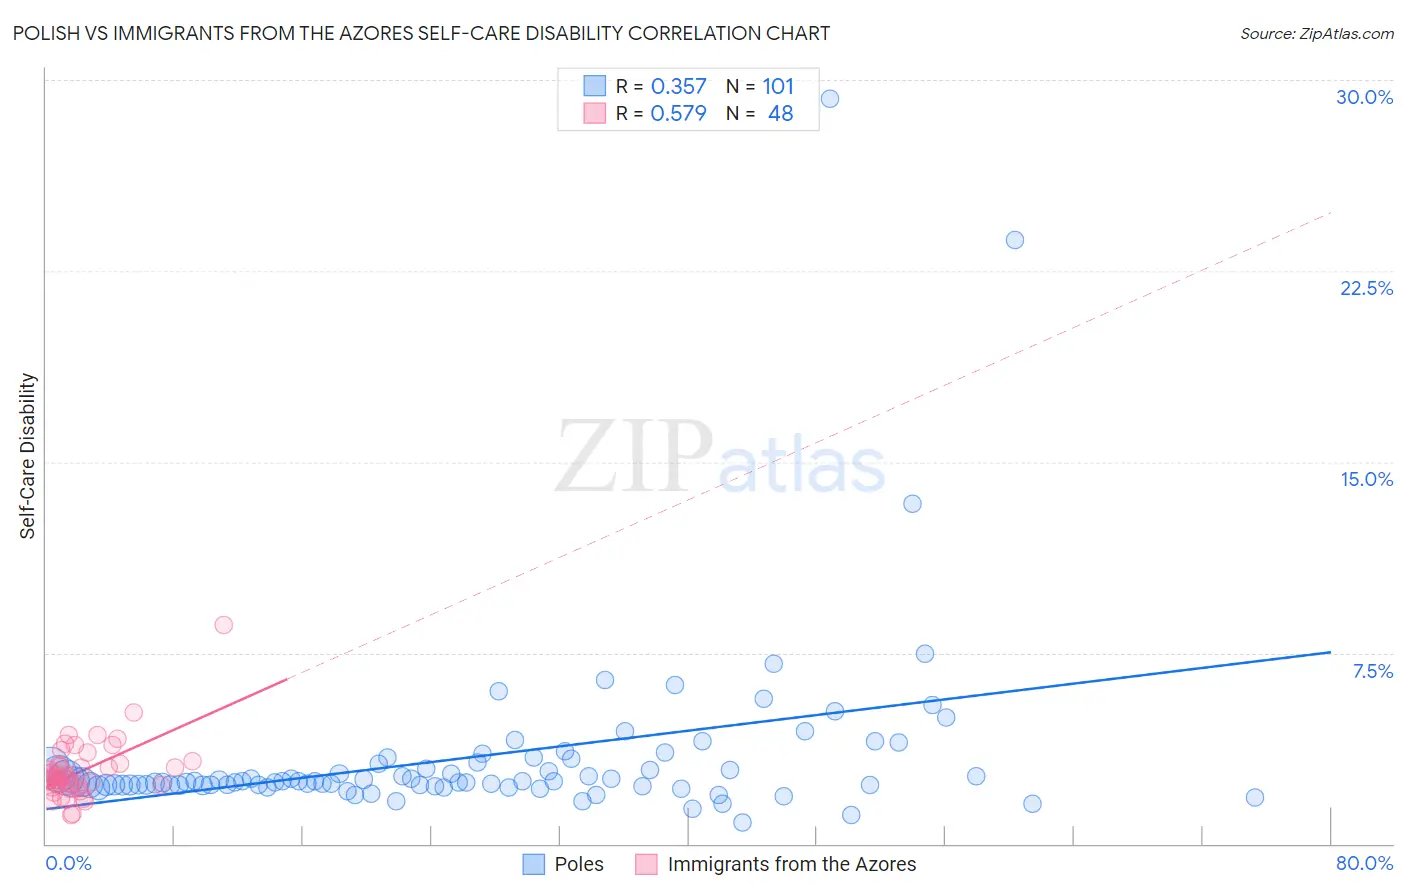
Polish vs Immigrants from the Azores Self-Care Disability Correlation Chart
The statistical analysis conducted on geographies consisting of 558,400,698 people shows a mild positive correlation between the proportion of Poles and percentage of population with self-care disability in the United States with a correlation coefficient (R) of 0.357 and weighted average of 2.4%. Similarly, the statistical analysis conducted on geographies consisting of 46,255,700 people shows a substantial positive correlation between the proportion of Immigrants from the Azores and percentage of population with self-care disability in the United States with a correlation coefficient (R) of 0.579 and weighted average of 3.0%, a difference of 24.2%.
Self-Care Disability Correlation Summary
| Measurement | Polish | Immigrants from the Azores |
| Minimum | 0.81% | 1.1% |
| Maximum | 29.3% | 8.6% |
| Range | 28.5% | 7.4% |
| Mean | 3.4% | 2.9% |
| Median | 2.4% | 2.6% |
| Interquartile 25% (IQ1) | 2.3% | 2.3% |
| Interquartile 75% (IQ3) | 3.2% | 3.1% |
| Interquartile Range (IQR) | 0.88% | 0.84% |
| Standard Deviation (Sample) | 3.7% | 1.2% |
| Standard Deviation (Population) | 3.7% | 1.2% |
Similar Demographics by Self-Care Disability
Demographics Similar to Poles by Self-Care Disability
In terms of self-care disability, the demographic groups most similar to Poles are Immigrants from South America (2.4%, a difference of 0.010%), Immigrants from Austria (2.4%, a difference of 0.020%), Immigrants from Colombia (2.4%, a difference of 0.040%), Immigrants from Romania (2.4%, a difference of 0.050%), and Russian (2.4%, a difference of 0.080%).
| Demographics | Rating | Rank | Self-Care Disability |
| Immigrants | North America | 90.2 /100 | #124 | Exceptional 2.4% |
| Immigrants | Morocco | 90.2 /100 | #124 | Exceptional 2.4% |
| Hmong | 89.9 /100 | #126 | Excellent 2.4% |
| Colombians | 89.7 /100 | #127 | Excellent 2.4% |
| Immigrants | Hungary | 89.6 /100 | #128 | Excellent 2.4% |
| Immigrants | Romania | 89.3 /100 | #129 | Excellent 2.4% |
| Immigrants | Austria | 89.0 /100 | #130 | Excellent 2.4% |
| Poles | 88.9 /100 | #131 | Excellent 2.4% |
| Immigrants | South America | 88.8 /100 | #132 | Excellent 2.4% |
| Immigrants | Colombia | 88.5 /100 | #133 | Excellent 2.4% |
| Russians | 88.2 /100 | #134 | Excellent 2.4% |
| Laotians | 87.8 /100 | #135 | Excellent 2.4% |
| South American Indians | 87.2 /100 | #136 | Excellent 2.4% |
| Austrians | 87.0 /100 | #137 | Excellent 2.4% |
| Immigrants | Croatia | 86.6 /100 | #138 | Excellent 2.4% |
Demographics Similar to Immigrants from the Azores by Self-Care Disability
In terms of self-care disability, the demographic groups most similar to Immigrants from the Azores are Houma (3.0%, a difference of 0.050%), Dutch West Indian (3.0%, a difference of 0.12%), Immigrants from Yemen (3.0%, a difference of 0.16%), Kiowa (3.0%, a difference of 0.35%), and Lumbee (3.0%, a difference of 0.71%).
| Demographics | Rating | Rank | Self-Care Disability |
| Hopi | 0.0 /100 | #328 | Tragic 2.9% |
| Cajuns | 0.0 /100 | #329 | Tragic 2.9% |
| Nepalese | 0.0 /100 | #330 | Tragic 3.0% |
| Lumbee | 0.0 /100 | #331 | Tragic 3.0% |
| Kiowa | 0.0 /100 | #332 | Tragic 3.0% |
| Dutch West Indians | 0.0 /100 | #333 | Tragic 3.0% |
| Houma | 0.0 /100 | #334 | Tragic 3.0% |
| Immigrants | Azores | 0.0 /100 | #335 | Tragic 3.0% |
| Immigrants | Yemen | 0.0 /100 | #336 | Tragic 3.0% |
| Choctaw | 0.0 /100 | #337 | Tragic 3.0% |
| Cape Verdeans | 0.0 /100 | #338 | Tragic 3.0% |
| Immigrants | Dominican Republic | 0.0 /100 | #339 | Tragic 3.0% |
| Immigrants | Cabo Verde | 0.0 /100 | #340 | Tragic 3.1% |
| Dominicans | 0.0 /100 | #341 | Tragic 3.1% |
| Colville | 0.0 /100 | #342 | Tragic 3.1% |