Polish vs Immigrants from Ecuador Bachelor's Degree

COMPARE

Polish
Race
Ancestry
AfghanAfricanAlaska NativeAlaskan AthabascanAlbanianAleutAlsatianAmericanApacheArabArapahoArgentineanArmenianAssyrian/Chaldean/SyriacAustralianAustrianBahamianBangladeshiBarbadianBasqueBelgianBelizeanBermudanBhutaneseBlackfeetBolivianBrazilianBritishBritish West IndianBulgarianBurmeseCajunCambodianCanadianCape VerdeanCarpatho RusynCelticCentral AmericanCentral American IndianCherokeeCheyenneChickasawChileanChineseChippewaChoctawColombianColvilleComancheCosta RicanCreeCreekCroatianCrowCubanCypriotCzechCzechoslovakianDanishDelawareDominicanDutchDutch West IndianEastern EuropeanEcuadorianEgyptianEnglishEstonianEthiopianEuropeanFijianFilipinoFinnishFrenchFrench American IndianFrench CanadianGermanGerman RussianGhanaianGreekGuamanian/ChamorroGuatemalanGuyaneseHaitianHmongHonduranHopiHoumaHungarianIcelanderIndian (Asian)IndonesianInupiatIranianIraqiIrishIroquoisIsraeliItalianJamaicanJapaneseJordanianKenyanKiowaKoreanLaotianLatvianLebaneseLiberianLithuanianLumbeeLuxembourgerMacedonianMalaysianMalteseMarshalleseMenomineeMexicanMexican American IndianMongolianMoroccanNative HawaiianNavajoNepaleseNew ZealanderNicaraguanNigerianNorthern EuropeanNorwegianOkinawanOsageOttawaPaiutePakistaniPalestinianPanamanianParaguayanPennsylvania GermanPeruvianPimaPolishPortuguesePotawatomiPuebloPuerto RicanPuget Sound SalishRomanianRussianSalvadoranSamoanScandinavianScotch-IrishScottishSeminoleSenegaleseSerbianShoshoneSierra LeoneanSiouxSlavicSlovakSloveneSomaliSouth AfricanSouth AmericanSouth American IndianSoviet UnionSpaniardSpanishSpanish AmericanSpanish American IndianSri LankanSubsaharan AfricanSudaneseSwedishSwissSyrianTaiwaneseThaiTlingit-HaidaTohono O'OdhamTonganTrinidadian and TobagonianTsimshianTurkishU.S. Virgin IslanderUgandanUkrainianUruguayanUteVenezuelanVietnameseWelshWest IndianYakamaYaquiYugoslavianYumanYup'ikZimbabwean
Immigration
NonimmigrantsImmigrantsAfghanistanAfricaAlbaniaArgentinaArmeniaAsiaAustraliaAustriaBahamasBangladeshBarbadosBelarusBelgiumBelizeBoliviaBosnia and HerzegovinaBrazilBulgariaBurma/MyanmarCabo VerdeCambodiaCameroonCanadaCaribbeanCentral AmericaChileChinaColombiaCongoCosta RicaCroatiaCubaCzechoslovakiaDenmarkDominicaDominican RepublicEastern AfricaEastern AsiaEastern EuropeEgyptEl SalvadorEnglandEritreaEthiopiaEuropeFijiFranceGermanyGhanaGreeceGrenadaGuatemalaGuyanaHaitiHondurasHong KongHungaryIndiaIndonesiaIranIraqIrelandIsraelItalyJamaicaJapanJordanKazakhstanKenyaKoreaKuwaitLaosLatin AmericaLatviaLebanonLiberiaLithuaniaMalaysiaMexicoMicronesiaMiddle AfricaMoldovaMoroccoNepalNetherlandsNicaraguaNigeriaNorth AmericaNorth MacedoniaNorthern AfricaNorthern EuropeNorwayOceaniaPakistanPanamaPeruPhilippinesPolandPortugalRomaniaRussiaSaudi ArabiaScotlandSenegalSerbiaSierra LeoneSingaporeSomaliaSouth AfricaSouth AmericaSouth Central AsiaSouth Eastern AsiaSouthern EuropeSpainSri LankaSt. Vincent and the GrenadinesSudanSwedenSwitzerlandSyriaTaiwanThailandTrinidad and TobagoTurkeyUgandaUkraineUruguayUzbekistanVenezuelaVietnamWest IndiesWestern AfricaWestern AsiaWestern EuropeYemenZaireZimbabweAzores
Immigrants from Ecuador
Race
Ancestry
AfghanAfricanAlaska NativeAlaskan AthabascanAlbanianAleutAlsatianAmericanApacheArabArapahoArgentineanArmenianAssyrian/Chaldean/SyriacAustralianAustrianBahamianBangladeshiBarbadianBasqueBelgianBelizeanBermudanBhutaneseBlackfeetBolivianBrazilianBritishBritish West IndianBulgarianBurmeseCajunCambodianCanadianCape VerdeanCarpatho RusynCelticCentral AmericanCentral American IndianCherokeeCheyenneChickasawChileanChineseChippewaChoctawColombianColvilleComancheCosta RicanCreeCreekCroatianCrowCubanCypriotCzechCzechoslovakianDanishDelawareDominicanDutchDutch West IndianEastern EuropeanEcuadorianEgyptianEnglishEstonianEthiopianEuropeanFijianFilipinoFinnishFrenchFrench American IndianFrench CanadianGermanGerman RussianGhanaianGreekGuamanian/ChamorroGuatemalanGuyaneseHaitianHmongHonduranHopiHoumaHungarianIcelanderIndian (Asian)IndonesianInupiatIranianIraqiIrishIroquoisIsraeliItalianJamaicanJapaneseJordanianKenyanKiowaKoreanLaotianLatvianLebaneseLiberianLithuanianLumbeeLuxembourgerMacedonianMalaysianMalteseMarshalleseMenomineeMexicanMexican American IndianMongolianMoroccanNative HawaiianNavajoNepaleseNew ZealanderNicaraguanNigerianNorthern EuropeanNorwegianOkinawanOsageOttawaPaiutePakistaniPalestinianPanamanianParaguayanPennsylvania GermanPeruvianPimaPortuguesePotawatomiPuebloPuerto RicanPuget Sound SalishRomanianRussianSalvadoranSamoanScandinavianScotch-IrishScottishSeminoleSenegaleseSerbianShoshoneSierra LeoneanSiouxSlavicSlovakSloveneSomaliSouth AfricanSouth AmericanSouth American IndianSoviet UnionSpaniardSpanishSpanish AmericanSpanish American IndianSri LankanSubsaharan AfricanSudaneseSwedishSwissSyrianTaiwaneseThaiTlingit-HaidaTohono O'OdhamTonganTrinidadian and TobagonianTsimshianTurkishU.S. Virgin IslanderUgandanUkrainianUruguayanUteVenezuelanVietnameseWelshWest IndianYakamaYaquiYugoslavianYumanYup'ikZimbabwean
Immigration
NonimmigrantsImmigrantsAfghanistanAfricaAlbaniaArgentinaArmeniaAsiaAustraliaAustriaBahamasBangladeshBarbadosBelarusBelgiumBelizeBoliviaBosnia and HerzegovinaBrazilBulgariaBurma/MyanmarCabo VerdeCambodiaCameroonCanadaCaribbeanCentral AmericaChileChinaColombiaCongoCosta RicaCroatiaCubaCzechoslovakiaDenmarkDominicaDominican RepublicEastern AfricaEastern AsiaEastern EuropeEcuadorEgyptEl SalvadorEnglandEritreaEthiopiaEuropeFijiFranceGermanyGhanaGreeceGrenadaGuatemalaGuyanaHaitiHondurasHong KongHungaryIndiaIndonesiaIranIraqIrelandIsraelItalyJamaicaJapanJordanKazakhstanKenyaKoreaKuwaitLaosLatin AmericaLatviaLebanonLiberiaLithuaniaMalaysiaMexicoMicronesiaMiddle AfricaMoldovaMoroccoNepalNetherlandsNicaraguaNigeriaNorth AmericaNorth MacedoniaNorthern AfricaNorthern EuropeNorwayOceaniaPakistanPanamaPeruPhilippinesPolandPortugalRomaniaRussiaSaudi ArabiaScotlandSenegalSerbiaSierra LeoneSingaporeSomaliaSouth AfricaSouth AmericaSouth Central AsiaSouth Eastern AsiaSouthern EuropeSpainSri LankaSt. Vincent and the GrenadinesSudanSwedenSwitzerlandSyriaTaiwanThailandTrinidad and TobagoTurkeyUgandaUkraineUruguayUzbekistanVenezuelaVietnamWest IndiesWestern AfricaWestern AsiaWestern EuropeYemenZaireZimbabweAzores
Bachelor's Degree
Income
Poverty
Unemployment
Labor Participation
Family Structure
Vehicle Availability
Education Level
Disability

Bachelor's Degree Comparison

Poles

Immigrants from Ecuador

Good
Tragic
39.1%
BACHELOR'S DEGREE
79.8/ 100
METRIC RATING
143rd/ 347
METRIC RANK
34.7%
BACHELOR'S DEGREE
3.3/ 100
METRIC RATING
233rd/ 347
METRIC RANK

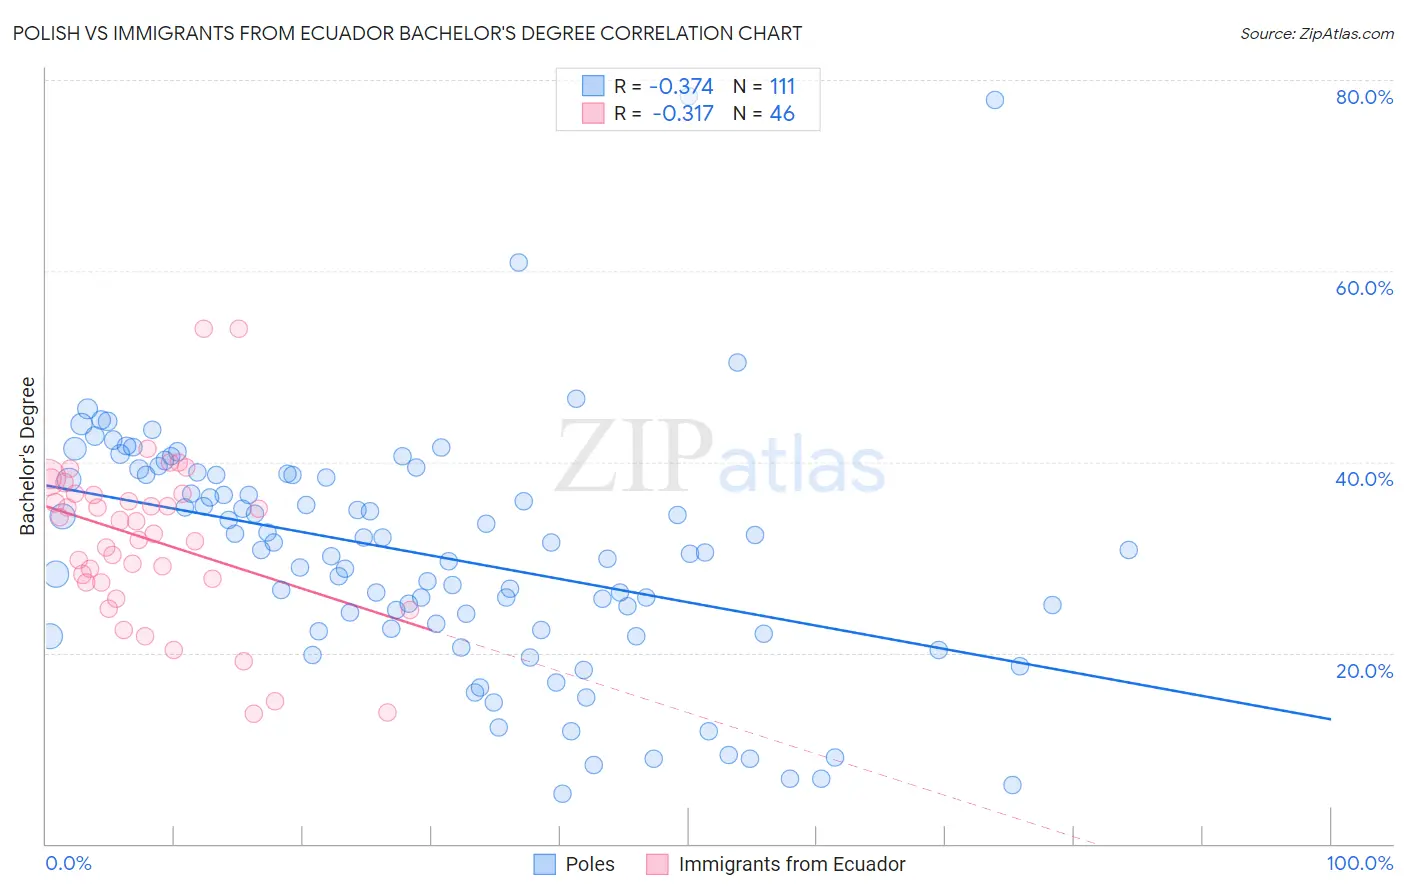
Polish vs Immigrants from Ecuador Bachelor's Degree Correlation Chart

The statistical analysis conducted on geographies consisting of 560,456,135 people shows a mild negative correlation between the proportion of Poles and percentage of population with at least bachelor's degree education in the United States with a correlation coefficient (R) of -0.374 and weighted average of 39.1%. Similarly, the statistical analysis conducted on geographies consisting of 271,013,109 people shows a mild negative correlation between the proportion of Immigrants from Ecuador and percentage of population with at least bachelor's degree education in the United States with a correlation coefficient (R) of -0.317 and weighted average of 34.7%, a difference of 12.6%.
Polish vs Immigrants from Ecuador Bachelor's Degree

Bachelor's Degree Correlation Summary

MeasurementPolishImmigrants from Ecuador
Minimum5.2%13.7%
Maximum78.3%54.0%
Range73.0%40.4%
Mean30.3%31.9%
Median30.7%33.1%
Interquartile 25% (IQ1)22.4%27.4%
Interquartile 75% (IQ3)38.7%36.6%
Interquartile Range (IQR)16.3%9.3%
Standard Deviation (Sample)12.7%8.5%
Standard Deviation (Population)12.7%8.4%

Similar Demographics by Bachelor's Degree

Demographics Similar to Poles by Bachelor's Degree

In terms of bachelor's degree, the demographic groups most similar to Poles are Immigrants from Afghanistan (39.1%, a difference of 0.020%), Slovene (39.1%, a difference of 0.050%), Swedish (39.1%, a difference of 0.090%), Immigrants from Sierra Leone (39.0%, a difference of 0.12%), and Iraqi (39.0%, a difference of 0.25%).
DemographicsRating | RankBachelor's Degree
Pakistanis
88.2
/100
|
#136
Excellent
39.7%
Icelanders
86.5
/100
|
#137
Excellent
39.5%
Europeans
85.6
/100
|
#138
Excellent
39.5%
Immigrants | Sudan
84.5
/100
|
#139
Excellent
39.4%
Immigrants | Armenia
84.1
/100
|
#140
Excellent
39.4%
South American Indians
83.6
/100
|
#141
Excellent
39.3%
Immigrants | North Macedonia
81.6
/100
|
#142
Excellent
39.2%
Poles
79.8
/100
|
#143
Good
39.1%
Immigrants | Afghanistan
79.7
/100
|
#144
Good
39.1%
Slovenes
79.5
/100
|
#145
Good
39.1%
Swedes
79.2
/100
|
#146
Good
39.1%
Immigrants | Sierra Leone
79.0
/100
|
#147
Good
39.0%
Iraqis
78.1
/100
|
#148
Good
39.0%
Immigrants | Poland
77.5
/100
|
#149
Good
39.0%
South Americans
77.3
/100
|
#150
Good
38.9%

Demographics Similar to Immigrants from Ecuador by Bachelor's Degree

In terms of bachelor's degree, the demographic groups most similar to Immigrants from Ecuador are Hmong (34.8%, a difference of 0.11%), Guamanian/Chamorro (34.6%, a difference of 0.22%), Immigrants from West Indies (34.6%, a difference of 0.31%), Liberian (34.6%, a difference of 0.42%), and Tlingit-Haida (34.6%, a difference of 0.45%).
DemographicsRating | RankBachelor's Degree
Portuguese
7.2
/100
|
#226
Tragic
35.5%
Ecuadorians
6.6
/100
|
#227
Tragic
35.4%
Immigrants | Trinidad and Tobago
6.0
/100
|
#228
Tragic
35.3%
Whites/Caucasians
5.9
/100
|
#229
Tragic
35.3%
Immigrants | Grenada
4.3
/100
|
#230
Tragic
35.0%
Immigrants | St. Vincent and the Grenadines
4.3
/100
|
#231
Tragic
35.0%
Hmong
3.4
/100
|
#232
Tragic
34.8%
Immigrants | Ecuador
3.3
/100
|
#233
Tragic
34.7%
Guamanians/Chamorros
3.0
/100
|
#234
Tragic
34.6%
Immigrants | West Indies
2.9
/100
|
#235
Tragic
34.6%
Liberians
2.8
/100
|
#236
Tragic
34.6%
Tlingit-Haida
2.8
/100
|
#237
Tragic
34.6%
Guyanese
2.5
/100
|
#238
Tragic
34.5%
British West Indians
2.5
/100
|
#239
Tragic
34.5%
Tongans
2.0
/100
|
#240
Tragic
34.3%