Polish vs Immigrants from Ecuador No Vehicles in Household
COMPARE
Polish
Immigrants from Ecuador
No Vehicles in Household
No Vehicles in Household Comparison
Poles
Immigrants from Ecuador
8.4%
NO VEHICLES IN HOUSEHOLD
99.6/ 100
METRIC RATING
73rd/ 347
METRIC RANK
23.8%
NO VEHICLES IN HOUSEHOLD
0.0/ 100
METRIC RATING
332nd/ 347
METRIC RANK
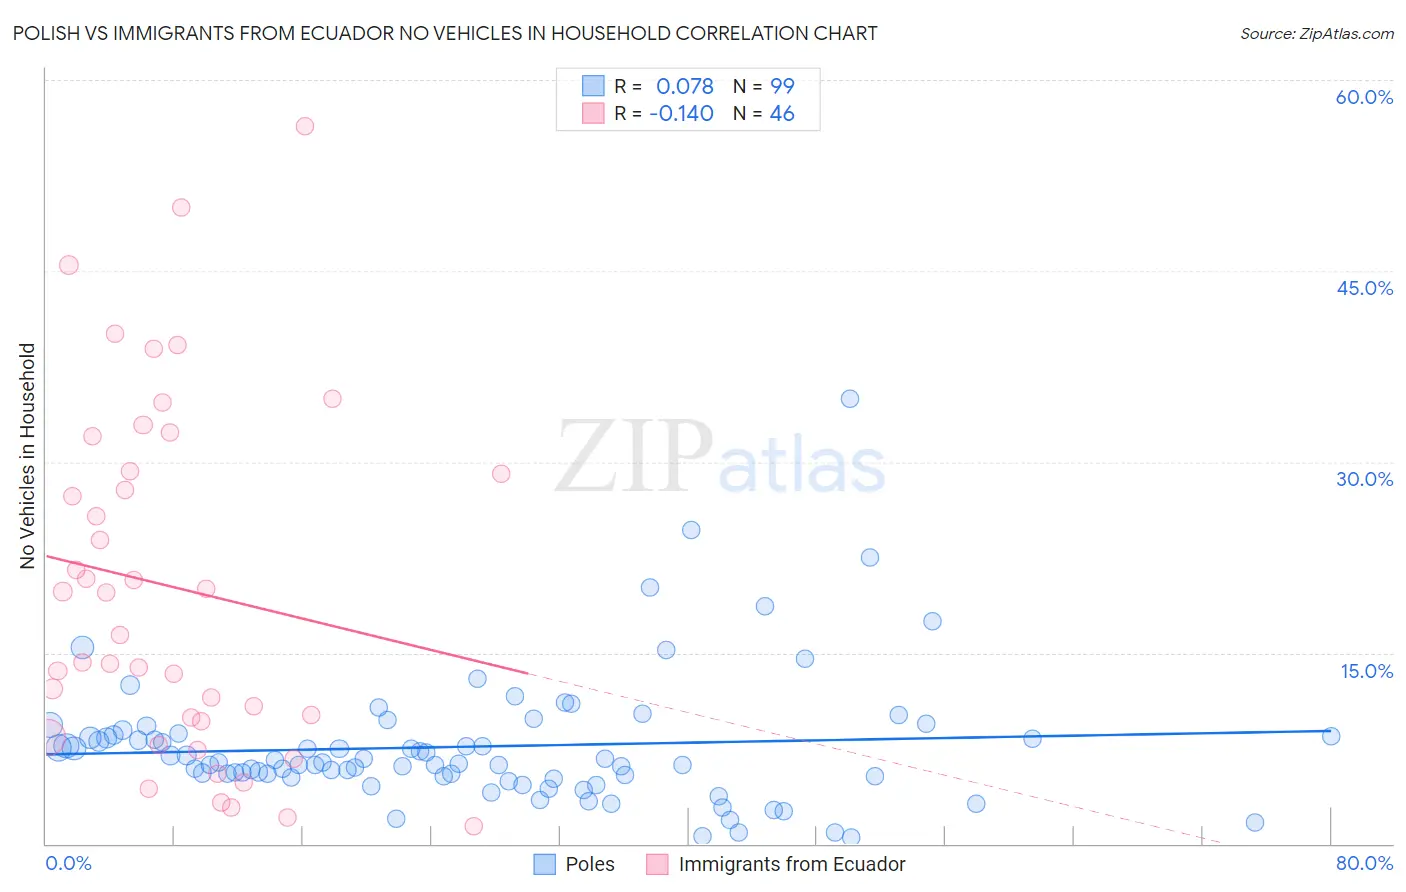
Polish vs Immigrants from Ecuador No Vehicles in Household Correlation Chart
The statistical analysis conducted on geographies consisting of 555,400,436 people shows a slight positive correlation between the proportion of Poles and percentage of households with no vehicle available in the United States with a correlation coefficient (R) of 0.078 and weighted average of 8.4%. Similarly, the statistical analysis conducted on geographies consisting of 270,577,361 people shows a poor negative correlation between the proportion of Immigrants from Ecuador and percentage of households with no vehicle available in the United States with a correlation coefficient (R) of -0.140 and weighted average of 23.8%, a difference of 182.4%.
No Vehicles in Household Correlation Summary
| Measurement | Polish | Immigrants from Ecuador |
| Minimum | 0.52% | 1.4% |
| Maximum | 35.0% | 56.4% |
| Range | 34.5% | 54.9% |
| Mean | 7.6% | 20.1% |
| Median | 6.4% | 18.1% |
| Interquartile 25% (IQ1) | 5.3% | 9.6% |
| Interquartile 75% (IQ3) | 8.5% | 29.2% |
| Interquartile Range (IQR) | 3.3% | 19.6% |
| Standard Deviation (Sample) | 5.1% | 13.8% |
| Standard Deviation (Population) | 5.1% | 13.6% |
Similar Demographics by No Vehicles in Household
Demographics Similar to Poles by No Vehicles in Household
In terms of no vehicles in household, the demographic groups most similar to Poles are Lithuanian (8.4%, a difference of 0.030%), Immigrants from Lebanon (8.4%, a difference of 0.060%), Cajun (8.4%, a difference of 0.090%), Spaniard (8.4%, a difference of 0.81%), and Cuban (8.5%, a difference of 0.86%).
| Demographics | Rating | Rank | No Vehicles in Household |
| Palestinians | 99.7 /100 | #66 | Exceptional 8.3% |
| Immigrants | Scotland | 99.7 /100 | #67 | Exceptional 8.3% |
| Immigrants | Iran | 99.7 /100 | #68 | Exceptional 8.4% |
| Spaniards | 99.7 /100 | #69 | Exceptional 8.4% |
| Cajuns | 99.6 /100 | #70 | Exceptional 8.4% |
| Immigrants | Lebanon | 99.6 /100 | #71 | Exceptional 8.4% |
| Lithuanians | 99.6 /100 | #72 | Exceptional 8.4% |
| Poles | 99.6 /100 | #73 | Exceptional 8.4% |
| Cubans | 99.5 /100 | #74 | Exceptional 8.5% |
| Jordanians | 99.5 /100 | #75 | Exceptional 8.5% |
| Immigrants | Philippines | 99.5 /100 | #76 | Exceptional 8.5% |
| Iranians | 99.5 /100 | #77 | Exceptional 8.6% |
| Immigrants | South Central Asia | 99.5 /100 | #78 | Exceptional 8.6% |
| Portuguese | 99.5 /100 | #79 | Exceptional 8.6% |
| Bolivians | 99.4 /100 | #80 | Exceptional 8.6% |
Demographics Similar to Immigrants from Ecuador by No Vehicles in Household
In terms of no vehicles in household, the demographic groups most similar to Immigrants from Ecuador are Trinidadian and Tobagonian (23.7%, a difference of 0.33%), West Indian (23.7%, a difference of 0.51%), Immigrants from Trinidad and Tobago (24.6%, a difference of 3.4%), Ecuadorian (22.8%, a difference of 4.7%), and Immigrants from Dominica (22.2%, a difference of 7.2%).
| Demographics | Rating | Rank | No Vehicles in Household |
| Senegalese | 0.0 /100 | #325 | Tragic 19.8% |
| Immigrants | West Indies | 0.0 /100 | #326 | Tragic 20.5% |
| Immigrants | Senegal | 0.0 /100 | #327 | Tragic 21.1% |
| Immigrants | Dominica | 0.0 /100 | #328 | Tragic 22.2% |
| Ecuadorians | 0.0 /100 | #329 | Tragic 22.8% |
| West Indians | 0.0 /100 | #330 | Tragic 23.7% |
| Trinidadians and Tobagonians | 0.0 /100 | #331 | Tragic 23.7% |
| Immigrants | Ecuador | 0.0 /100 | #332 | Tragic 23.8% |
| Immigrants | Trinidad and Tobago | 0.0 /100 | #333 | Tragic 24.6% |
| Immigrants | Bangladesh | 0.0 /100 | #334 | Tragic 25.8% |
| Barbadians | 0.0 /100 | #335 | Tragic 26.1% |
| Vietnamese | 0.0 /100 | #336 | Tragic 26.2% |
| Immigrants | Uzbekistan | 0.0 /100 | #337 | Tragic 26.7% |
| Guyanese | 0.0 /100 | #338 | Tragic 29.3% |
| Dominicans | 0.0 /100 | #339 | Tragic 29.4% |