Polish vs Jordanian Self-Care Disability
COMPARE
Polish
Jordanian
Self-Care Disability
Self-Care Disability Comparison
Poles
Jordanians
2.4%
SELF-CARE DISABILITY
88.9/ 100
METRIC RATING
131st/ 347
METRIC RANK
2.3%
SELF-CARE DISABILITY
99.7/ 100
METRIC RATING
47th/ 347
METRIC RANK
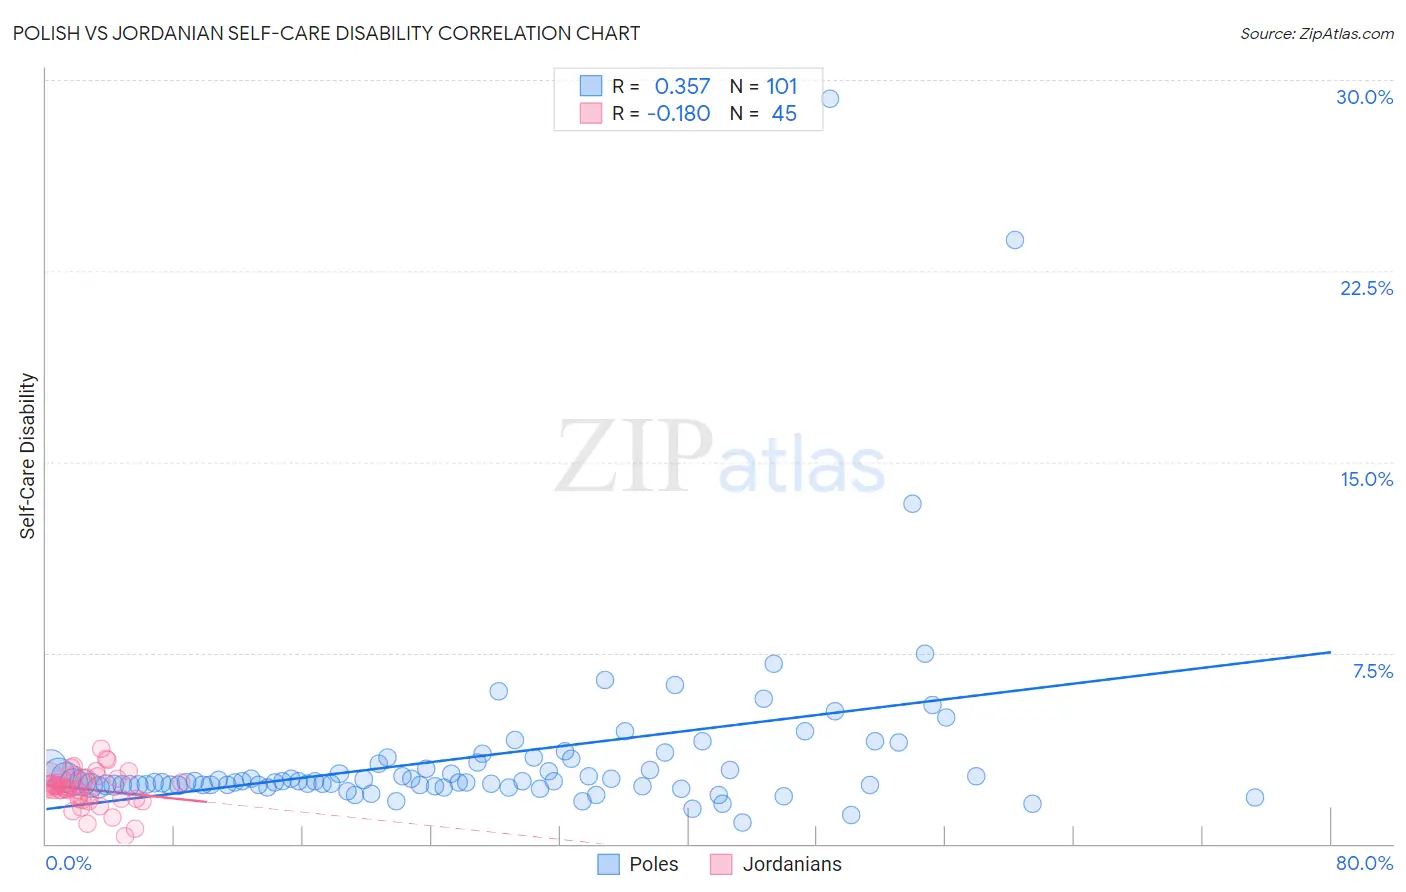
Polish vs Jordanian Self-Care Disability Correlation Chart
The statistical analysis conducted on geographies consisting of 558,400,698 people shows a mild positive correlation between the proportion of Poles and percentage of population with self-care disability in the United States with a correlation coefficient (R) of 0.357 and weighted average of 2.4%. Similarly, the statistical analysis conducted on geographies consisting of 166,373,634 people shows a poor negative correlation between the proportion of Jordanians and percentage of population with self-care disability in the United States with a correlation coefficient (R) of -0.180 and weighted average of 2.3%, a difference of 5.0%.
Self-Care Disability Correlation Summary
| Measurement | Polish | Jordanian |
| Minimum | 0.81% | 0.31% |
| Maximum | 29.3% | 3.7% |
| Range | 28.5% | 3.4% |
| Mean | 3.4% | 2.1% |
| Median | 2.4% | 2.2% |
| Interquartile 25% (IQ1) | 2.3% | 1.8% |
| Interquartile 75% (IQ3) | 3.2% | 2.5% |
| Interquartile Range (IQR) | 0.88% | 0.75% |
| Standard Deviation (Sample) | 3.7% | 0.69% |
| Standard Deviation (Population) | 3.7% | 0.68% |
Similar Demographics by Self-Care Disability
Demographics Similar to Poles by Self-Care Disability
In terms of self-care disability, the demographic groups most similar to Poles are Immigrants from South America (2.4%, a difference of 0.010%), Immigrants from Austria (2.4%, a difference of 0.020%), Immigrants from Colombia (2.4%, a difference of 0.040%), Immigrants from Romania (2.4%, a difference of 0.050%), and Russian (2.4%, a difference of 0.080%).
| Demographics | Rating | Rank | Self-Care Disability |
| Immigrants | North America | 90.2 /100 | #124 | Exceptional 2.4% |
| Immigrants | Morocco | 90.2 /100 | #124 | Exceptional 2.4% |
| Hmong | 89.9 /100 | #126 | Excellent 2.4% |
| Colombians | 89.7 /100 | #127 | Excellent 2.4% |
| Immigrants | Hungary | 89.6 /100 | #128 | Excellent 2.4% |
| Immigrants | Romania | 89.3 /100 | #129 | Excellent 2.4% |
| Immigrants | Austria | 89.0 /100 | #130 | Excellent 2.4% |
| Poles | 88.9 /100 | #131 | Excellent 2.4% |
| Immigrants | South America | 88.8 /100 | #132 | Excellent 2.4% |
| Immigrants | Colombia | 88.5 /100 | #133 | Excellent 2.4% |
| Russians | 88.2 /100 | #134 | Excellent 2.4% |
| Laotians | 87.8 /100 | #135 | Excellent 2.4% |
| South American Indians | 87.2 /100 | #136 | Excellent 2.4% |
| Austrians | 87.0 /100 | #137 | Excellent 2.4% |
| Immigrants | Croatia | 86.6 /100 | #138 | Excellent 2.4% |
Demographics Similar to Jordanians by Self-Care Disability
In terms of self-care disability, the demographic groups most similar to Jordanians are Immigrants from Malaysia (2.3%, a difference of 0.040%), Latvian (2.3%, a difference of 0.22%), Czech (2.3%, a difference of 0.23%), Immigrants from Brazil (2.3%, a difference of 0.24%), and Norwegian (2.3%, a difference of 0.31%).
| Demographics | Rating | Rank | Self-Care Disability |
| Iranians | 99.8 /100 | #40 | Exceptional 2.3% |
| Immigrants | Sudan | 99.8 /100 | #41 | Exceptional 2.3% |
| Immigrants | Uganda | 99.8 /100 | #42 | Exceptional 2.3% |
| Immigrants | Pakistan | 99.8 /100 | #43 | Exceptional 2.3% |
| Immigrants | South Africa | 99.8 /100 | #44 | Exceptional 2.3% |
| Norwegians | 99.8 /100 | #45 | Exceptional 2.3% |
| Czechs | 99.8 /100 | #46 | Exceptional 2.3% |
| Jordanians | 99.7 /100 | #47 | Exceptional 2.3% |
| Immigrants | Malaysia | 99.7 /100 | #48 | Exceptional 2.3% |
| Latvians | 99.7 /100 | #49 | Exceptional 2.3% |
| Immigrants | Brazil | 99.7 /100 | #50 | Exceptional 2.3% |
| Kenyans | 99.7 /100 | #51 | Exceptional 2.3% |
| Immigrants | Serbia | 99.6 /100 | #52 | Exceptional 2.3% |
| Australians | 99.6 /100 | #53 | Exceptional 2.3% |
| Argentineans | 99.6 /100 | #54 | Exceptional 2.3% |