Immigrants from Cuba vs Immigrants from Ecuador Self-Care Disability
COMPARE
Immigrants from Cuba
Immigrants from Ecuador
Self-Care Disability
Self-Care Disability Comparison
Immigrants from Cuba
Immigrants from Ecuador
2.8%
SELF-CARE DISABILITY
0.0/ 100
METRIC RATING
315th/ 347
METRIC RANK
2.6%
SELF-CARE DISABILITY
2.5/ 100
METRIC RATING
230th/ 347
METRIC RANK
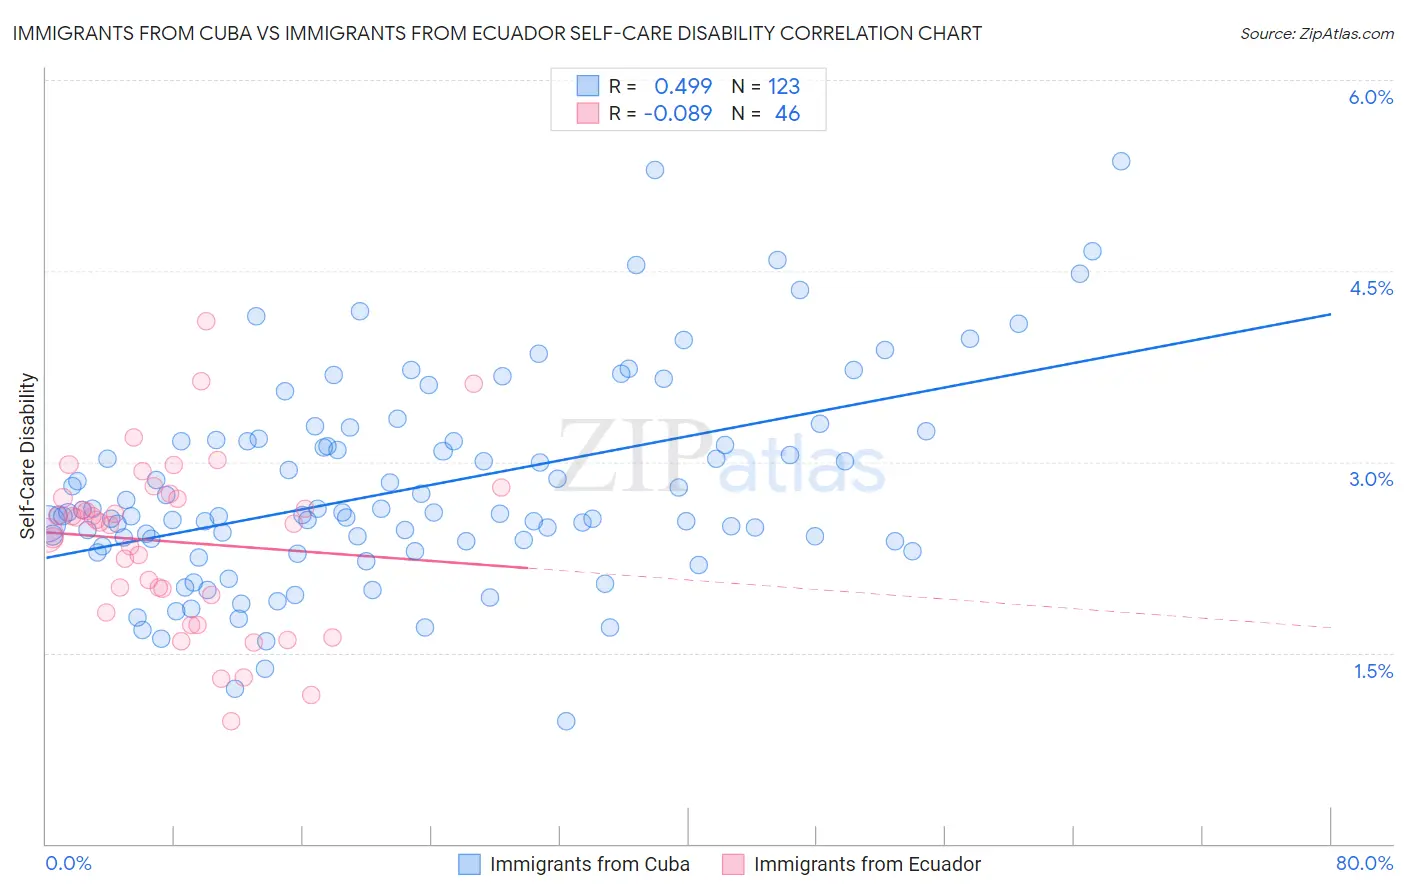
Immigrants from Cuba vs Immigrants from Ecuador Self-Care Disability Correlation Chart
The statistical analysis conducted on geographies consisting of 325,827,675 people shows a moderate positive correlation between the proportion of Immigrants from Cuba and percentage of population with self-care disability in the United States with a correlation coefficient (R) of 0.499 and weighted average of 2.8%. Similarly, the statistical analysis conducted on geographies consisting of 270,835,557 people shows a slight negative correlation between the proportion of Immigrants from Ecuador and percentage of population with self-care disability in the United States with a correlation coefficient (R) of -0.089 and weighted average of 2.6%, a difference of 10.4%.
Self-Care Disability Correlation Summary
| Measurement | Immigrants from Cuba | Immigrants from Ecuador |
| Minimum | 0.96% | 0.96% |
| Maximum | 5.4% | 4.1% |
| Range | 4.4% | 3.1% |
| Mean | 2.8% | 2.4% |
| Median | 2.6% | 2.5% |
| Interquartile 25% (IQ1) | 2.4% | 2.0% |
| Interquartile 75% (IQ3) | 3.2% | 2.7% |
| Interquartile Range (IQR) | 0.79% | 0.76% |
| Standard Deviation (Sample) | 0.80% | 0.66% |
| Standard Deviation (Population) | 0.80% | 0.65% |
Similar Demographics by Self-Care Disability
Demographics Similar to Immigrants from Cuba by Self-Care Disability
In terms of self-care disability, the demographic groups most similar to Immigrants from Cuba are Menominee (2.8%, a difference of 0.10%), Creek (2.8%, a difference of 0.21%), Immigrants from Dominica (2.8%, a difference of 0.23%), Assyrian/Chaldean/Syriac (2.8%, a difference of 0.24%), and Spanish American Indian (2.9%, a difference of 0.40%).
| Demographics | Rating | Rank | Self-Care Disability |
| Immigrants | Grenada | 0.0 /100 | #308 | Tragic 2.8% |
| Bangladeshis | 0.0 /100 | #309 | Tragic 2.8% |
| British West Indians | 0.0 /100 | #310 | Tragic 2.8% |
| Puget Sound Salish | 0.0 /100 | #311 | Tragic 2.8% |
| Immigrants | Caribbean | 0.0 /100 | #312 | Tragic 2.8% |
| Spanish Americans | 0.0 /100 | #313 | Tragic 2.8% |
| Creek | 0.0 /100 | #314 | Tragic 2.8% |
| Immigrants | Cuba | 0.0 /100 | #315 | Tragic 2.8% |
| Menominee | 0.0 /100 | #316 | Tragic 2.8% |
| Immigrants | Dominica | 0.0 /100 | #317 | Tragic 2.8% |
| Assyrians/Chaldeans/Syriacs | 0.0 /100 | #318 | Tragic 2.8% |
| Spanish American Indians | 0.0 /100 | #319 | Tragic 2.9% |
| Chickasaw | 0.0 /100 | #320 | Tragic 2.9% |
| Navajo | 0.0 /100 | #321 | Tragic 2.9% |
| Comanche | 0.0 /100 | #322 | Tragic 2.9% |
Demographics Similar to Immigrants from Ecuador by Self-Care Disability
In terms of self-care disability, the demographic groups most similar to Immigrants from Ecuador are Guamanian/Chamorro (2.6%, a difference of 0.010%), Immigrants from Philippines (2.6%, a difference of 0.080%), Guatemalan (2.6%, a difference of 0.080%), Immigrants from Guatemala (2.6%, a difference of 0.15%), and Chinese (2.6%, a difference of 0.16%).
| Demographics | Rating | Rank | Self-Care Disability |
| French Canadians | 3.8 /100 | #223 | Tragic 2.6% |
| Osage | 3.6 /100 | #224 | Tragic 2.6% |
| Iraqis | 3.2 /100 | #225 | Tragic 2.6% |
| Chinese | 2.9 /100 | #226 | Tragic 2.6% |
| Immigrants | Philippines | 2.7 /100 | #227 | Tragic 2.6% |
| Guatemalans | 2.7 /100 | #228 | Tragic 2.6% |
| Guamanians/Chamorros | 2.5 /100 | #229 | Tragic 2.6% |
| Immigrants | Ecuador | 2.5 /100 | #230 | Tragic 2.6% |
| Immigrants | Guatemala | 2.2 /100 | #231 | Tragic 2.6% |
| Albanians | 2.2 /100 | #232 | Tragic 2.6% |
| Liberians | 2.1 /100 | #233 | Tragic 2.6% |
| Vietnamese | 2.1 /100 | #234 | Tragic 2.6% |
| Bahamians | 2.0 /100 | #235 | Tragic 2.6% |
| Bermudans | 1.9 /100 | #236 | Tragic 2.6% |
| Immigrants | Senegal | 1.6 /100 | #237 | Tragic 2.6% |