Immigrants from Barbados vs Immigrants from Ecuador Self-Care Disability
COMPARE
Immigrants from Barbados
Immigrants from Ecuador
Self-Care Disability
Self-Care Disability Comparison
Immigrants from Barbados
Immigrants from Ecuador
2.7%
SELF-CARE DISABILITY
0.0/ 100
METRIC RATING
288th/ 347
METRIC RANK
2.6%
SELF-CARE DISABILITY
2.5/ 100
METRIC RATING
230th/ 347
METRIC RANK
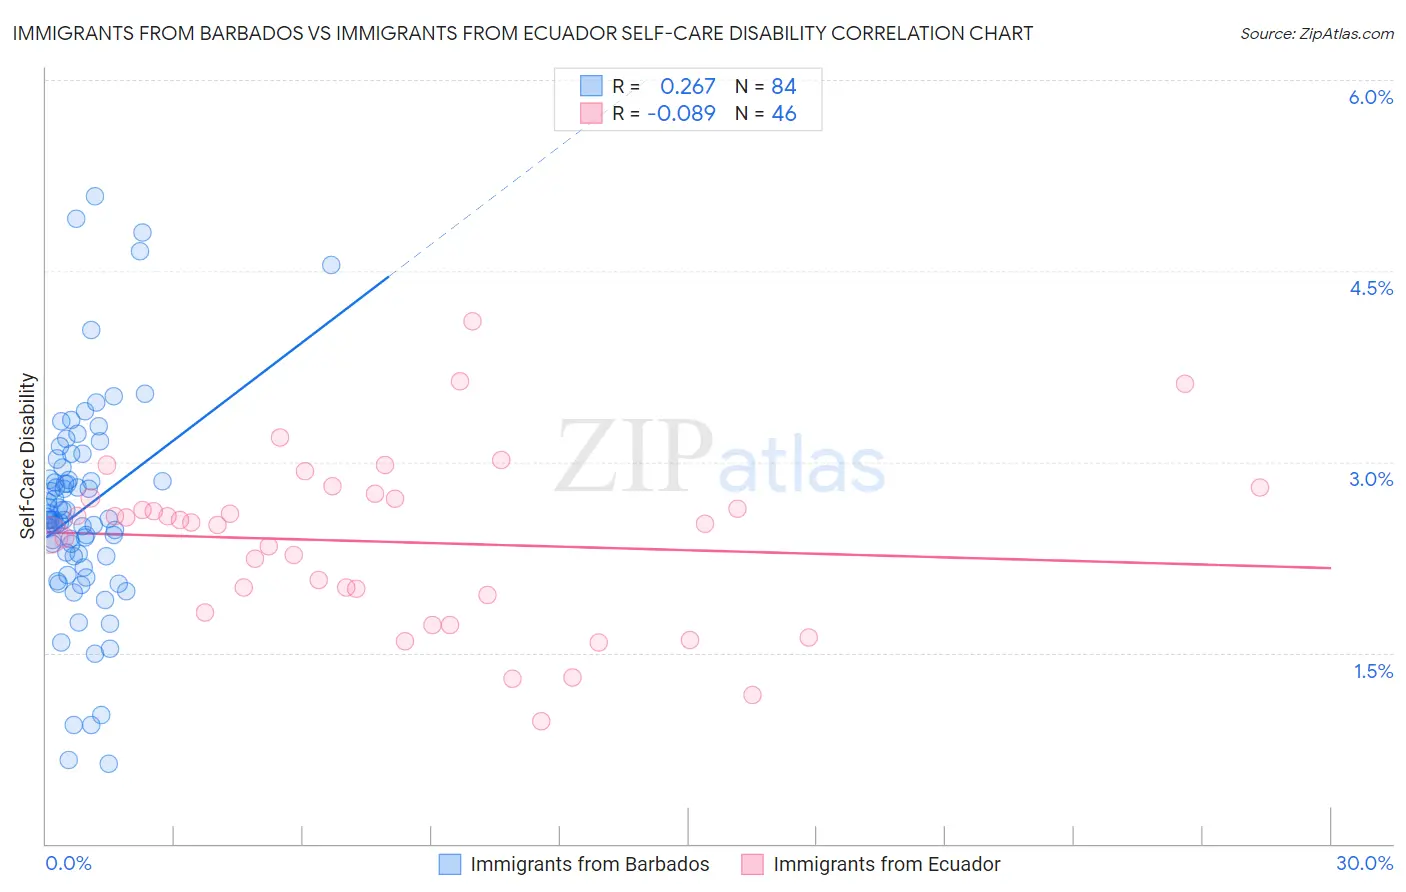
Immigrants from Barbados vs Immigrants from Ecuador Self-Care Disability Correlation Chart
The statistical analysis conducted on geographies consisting of 112,740,636 people shows a weak positive correlation between the proportion of Immigrants from Barbados and percentage of population with self-care disability in the United States with a correlation coefficient (R) of 0.267 and weighted average of 2.7%. Similarly, the statistical analysis conducted on geographies consisting of 270,835,557 people shows a slight negative correlation between the proportion of Immigrants from Ecuador and percentage of population with self-care disability in the United States with a correlation coefficient (R) of -0.089 and weighted average of 2.6%, a difference of 5.8%.
Self-Care Disability Correlation Summary
| Measurement | Immigrants from Barbados | Immigrants from Ecuador |
| Minimum | 0.63% | 0.96% |
| Maximum | 5.1% | 4.1% |
| Range | 4.5% | 3.1% |
| Mean | 2.6% | 2.4% |
| Median | 2.6% | 2.5% |
| Interquartile 25% (IQ1) | 2.3% | 2.0% |
| Interquartile 75% (IQ3) | 2.9% | 2.7% |
| Interquartile Range (IQR) | 0.65% | 0.76% |
| Standard Deviation (Sample) | 0.84% | 0.66% |
| Standard Deviation (Population) | 0.83% | 0.65% |
Similar Demographics by Self-Care Disability
Demographics Similar to Immigrants from Barbados by Self-Care Disability
In terms of self-care disability, the demographic groups most similar to Immigrants from Barbados are Immigrants from Jamaica (2.7%, a difference of 0.030%), African (2.7%, a difference of 0.10%), Cuban (2.7%, a difference of 0.25%), French American Indian (2.7%, a difference of 0.37%), and Guyanese (2.7%, a difference of 0.52%).
| Demographics | Rating | Rank | Self-Care Disability |
| Immigrants | Iraq | 0.0 /100 | #281 | Tragic 2.7% |
| Apache | 0.0 /100 | #282 | Tragic 2.7% |
| Delaware | 0.0 /100 | #283 | Tragic 2.7% |
| Fijians | 0.0 /100 | #284 | Tragic 2.7% |
| Jamaicans | 0.0 /100 | #285 | Tragic 2.7% |
| French American Indians | 0.0 /100 | #286 | Tragic 2.7% |
| Immigrants | Jamaica | 0.0 /100 | #287 | Tragic 2.7% |
| Immigrants | Barbados | 0.0 /100 | #288 | Tragic 2.7% |
| Africans | 0.0 /100 | #289 | Tragic 2.7% |
| Cubans | 0.0 /100 | #290 | Tragic 2.7% |
| Guyanese | 0.0 /100 | #291 | Tragic 2.7% |
| Central American Indians | 0.0 /100 | #292 | Tragic 2.7% |
| Belizeans | 0.0 /100 | #293 | Tragic 2.7% |
| Blackfeet | 0.0 /100 | #294 | Tragic 2.7% |
| Barbadians | 0.0 /100 | #295 | Tragic 2.7% |
Demographics Similar to Immigrants from Ecuador by Self-Care Disability
In terms of self-care disability, the demographic groups most similar to Immigrants from Ecuador are Guamanian/Chamorro (2.6%, a difference of 0.010%), Immigrants from Philippines (2.6%, a difference of 0.080%), Guatemalan (2.6%, a difference of 0.080%), Immigrants from Guatemala (2.6%, a difference of 0.15%), and Chinese (2.6%, a difference of 0.16%).
| Demographics | Rating | Rank | Self-Care Disability |
| French Canadians | 3.8 /100 | #223 | Tragic 2.6% |
| Osage | 3.6 /100 | #224 | Tragic 2.6% |
| Iraqis | 3.2 /100 | #225 | Tragic 2.6% |
| Chinese | 2.9 /100 | #226 | Tragic 2.6% |
| Immigrants | Philippines | 2.7 /100 | #227 | Tragic 2.6% |
| Guatemalans | 2.7 /100 | #228 | Tragic 2.6% |
| Guamanians/Chamorros | 2.5 /100 | #229 | Tragic 2.6% |
| Immigrants | Ecuador | 2.5 /100 | #230 | Tragic 2.6% |
| Immigrants | Guatemala | 2.2 /100 | #231 | Tragic 2.6% |
| Albanians | 2.2 /100 | #232 | Tragic 2.6% |
| Liberians | 2.1 /100 | #233 | Tragic 2.6% |
| Vietnamese | 2.1 /100 | #234 | Tragic 2.6% |
| Bahamians | 2.0 /100 | #235 | Tragic 2.6% |
| Bermudans | 1.9 /100 | #236 | Tragic 2.6% |
| Immigrants | Senegal | 1.6 /100 | #237 | Tragic 2.6% |