Pima vs Trinidadian and Tobagonian Vision Disability
COMPARE
Pima
Trinidadian and Tobagonian
Vision Disability
Vision Disability Comparison
Pima
Trinidadians and Tobagonians
3.3%
VISION DISABILITY
0.0/ 100
METRIC RATING
343rd/ 347
METRIC RANK
2.2%
VISION DISABILITY
8.2/ 100
METRIC RATING
214th/ 347
METRIC RANK
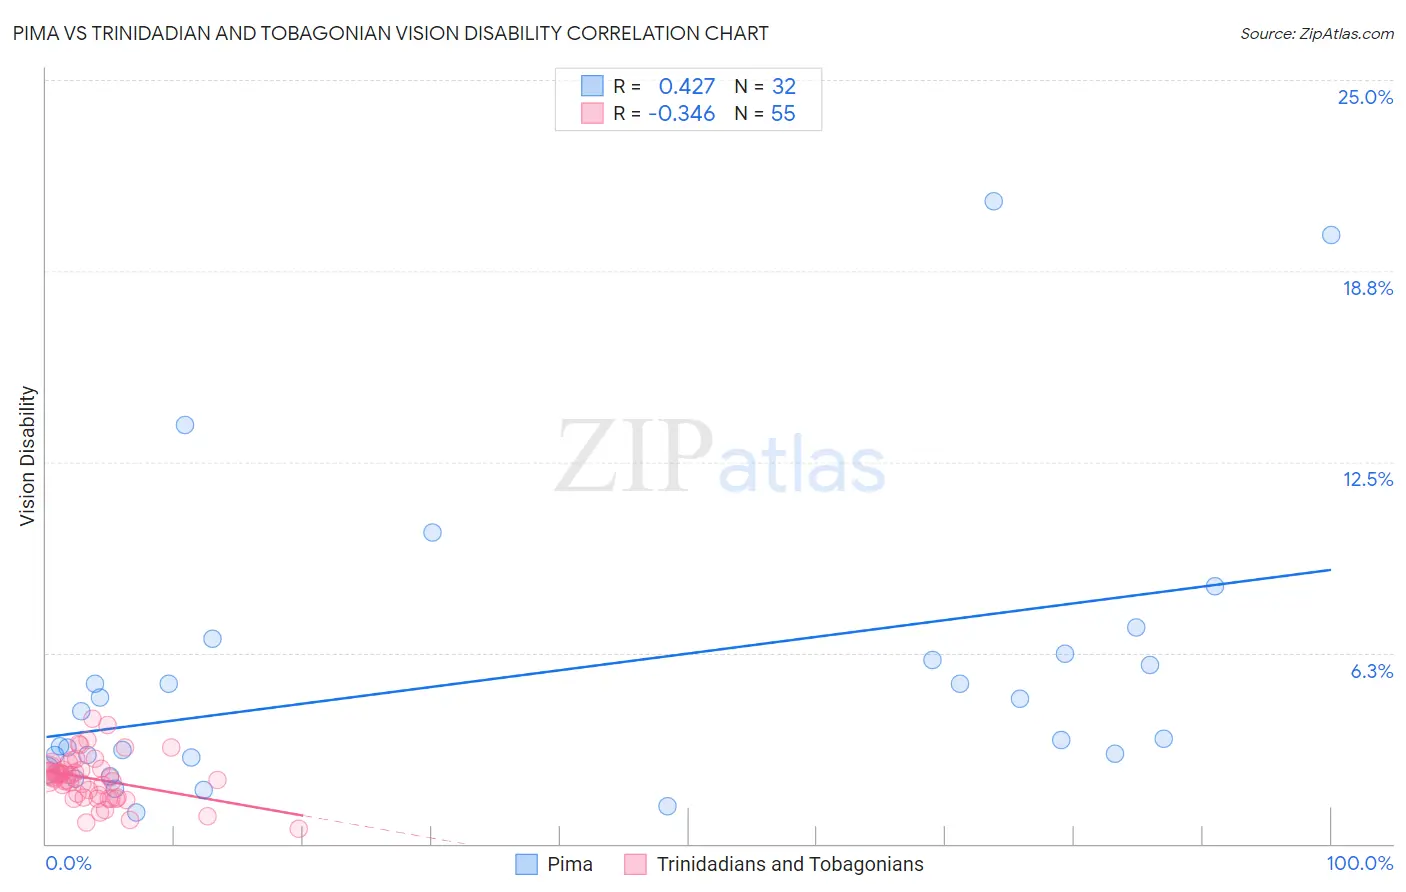
Pima vs Trinidadian and Tobagonian Vision Disability Correlation Chart
The statistical analysis conducted on geographies consisting of 61,535,675 people shows a moderate positive correlation between the proportion of Pima and percentage of population with vision disability in the United States with a correlation coefficient (R) of 0.427 and weighted average of 3.3%. Similarly, the statistical analysis conducted on geographies consisting of 219,745,653 people shows a mild negative correlation between the proportion of Trinidadians and Tobagonians and percentage of population with vision disability in the United States with a correlation coefficient (R) of -0.346 and weighted average of 2.2%, a difference of 48.2%.
Vision Disability Correlation Summary
| Measurement | Pima | Trinidadian and Tobagonian |
| Minimum | 1.0% | 0.49% |
| Maximum | 21.0% | 4.1% |
| Range | 20.0% | 3.6% |
| Mean | 5.5% | 2.1% |
| Median | 3.9% | 2.2% |
| Interquartile 25% (IQ1) | 2.9% | 1.5% |
| Interquartile 75% (IQ3) | 6.1% | 2.4% |
| Interquartile Range (IQR) | 3.3% | 0.92% |
| Standard Deviation (Sample) | 4.8% | 0.75% |
| Standard Deviation (Population) | 4.7% | 0.74% |
Similar Demographics by Vision Disability
Demographics Similar to Pima by Vision Disability
In terms of vision disability, the demographic groups most similar to Pima are Pueblo (3.3%, a difference of 0.030%), Choctaw (3.3%, a difference of 1.1%), Lumbee (3.4%, a difference of 1.6%), Kiowa (3.3%, a difference of 2.5%), and Houma (3.4%, a difference of 3.3%).
| Demographics | Rating | Rank | Vision Disability |
| Cajuns | 0.0 /100 | #333 | Tragic 3.1% |
| Cheyenne | 0.0 /100 | #334 | Tragic 3.1% |
| Navajo | 0.0 /100 | #335 | Tragic 3.1% |
| Alaskan Athabascans | 0.0 /100 | #336 | Tragic 3.1% |
| Dutch West Indians | 0.0 /100 | #337 | Tragic 3.2% |
| Chickasaw | 0.0 /100 | #338 | Tragic 3.2% |
| Tsimshian | 0.0 /100 | #339 | Tragic 3.2% |
| Creek | 0.0 /100 | #340 | Tragic 3.2% |
| Kiowa | 0.0 /100 | #341 | Tragic 3.3% |
| Choctaw | 0.0 /100 | #342 | Tragic 3.3% |
| Pima | 0.0 /100 | #343 | Tragic 3.3% |
| Pueblo | 0.0 /100 | #344 | Tragic 3.3% |
| Lumbee | 0.0 /100 | #345 | Tragic 3.4% |
| Houma | 0.0 /100 | #346 | Tragic 3.4% |
| Puerto Ricans | 0.0 /100 | #347 | Tragic 3.9% |
Demographics Similar to Trinidadians and Tobagonians by Vision Disability
In terms of vision disability, the demographic groups most similar to Trinidadians and Tobagonians are Immigrants from Ghana (2.2%, a difference of 0.13%), Bermudan (2.2%, a difference of 0.14%), Nigerian (2.3%, a difference of 0.21%), Indonesian (2.2%, a difference of 0.23%), and Immigrants from Trinidad and Tobago (2.3%, a difference of 0.50%).
| Demographics | Rating | Rank | Vision Disability |
| Immigrants | Nigeria | 13.5 /100 | #207 | Poor 2.2% |
| Germans | 13.4 /100 | #208 | Poor 2.2% |
| Immigrants | Brazil | 13.1 /100 | #209 | Poor 2.2% |
| Immigrants | Uruguay | 11.5 /100 | #210 | Poor 2.2% |
| Indonesians | 9.5 /100 | #211 | Tragic 2.2% |
| Bermudans | 9.0 /100 | #212 | Tragic 2.2% |
| Immigrants | Ghana | 8.9 /100 | #213 | Tragic 2.2% |
| Trinidadians and Tobagonians | 8.2 /100 | #214 | Tragic 2.2% |
| Nigerians | 7.2 /100 | #215 | Tragic 2.3% |
| Immigrants | Trinidad and Tobago | 6.1 /100 | #216 | Tragic 2.3% |
| Barbadians | 5.1 /100 | #217 | Tragic 2.3% |
| Portuguese | 4.9 /100 | #218 | Tragic 2.3% |
| Ecuadorians | 4.6 /100 | #219 | Tragic 2.3% |
| Guamanians/Chamorros | 3.9 /100 | #220 | Tragic 2.3% |
| French Canadians | 3.9 /100 | #221 | Tragic 2.3% |