French vs Trinidadian and Tobagonian Vision Disability
COMPARE
French
Trinidadian and Tobagonian
Vision Disability
Vision Disability Comparison
French
Trinidadians and Tobagonians
2.3%
VISION DISABILITY
0.5/ 100
METRIC RATING
246th/ 347
METRIC RANK
2.2%
VISION DISABILITY
8.2/ 100
METRIC RATING
214th/ 347
METRIC RANK
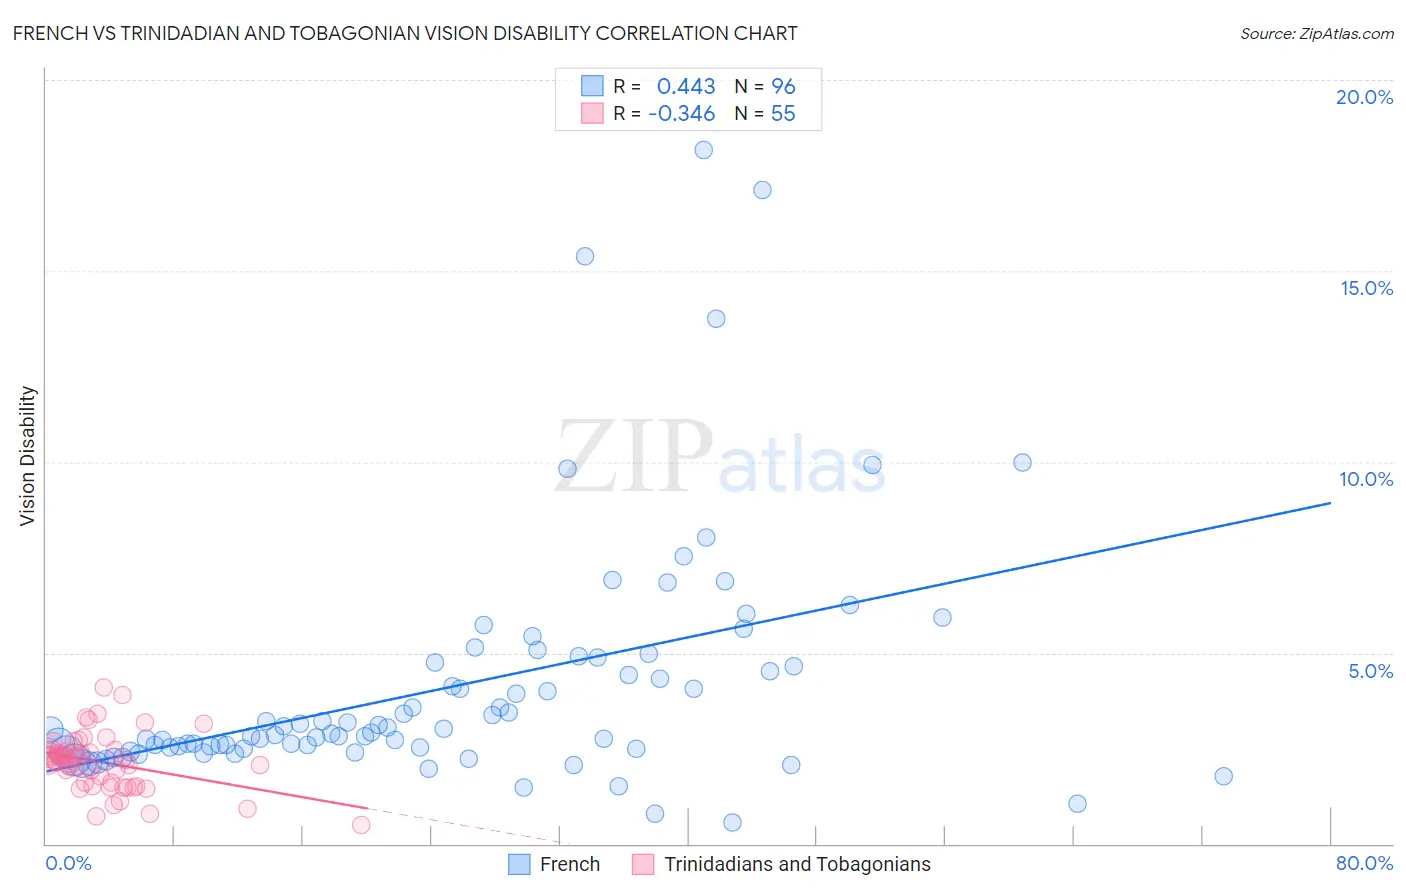
French vs Trinidadian and Tobagonian Vision Disability Correlation Chart
The statistical analysis conducted on geographies consisting of 570,344,366 people shows a moderate positive correlation between the proportion of French and percentage of population with vision disability in the United States with a correlation coefficient (R) of 0.443 and weighted average of 2.3%. Similarly, the statistical analysis conducted on geographies consisting of 219,745,653 people shows a mild negative correlation between the proportion of Trinidadians and Tobagonians and percentage of population with vision disability in the United States with a correlation coefficient (R) of -0.346 and weighted average of 2.2%, a difference of 4.3%.
Vision Disability Correlation Summary
| Measurement | French | Trinidadian and Tobagonian |
| Minimum | 0.55% | 0.49% |
| Maximum | 18.2% | 4.1% |
| Range | 17.6% | 3.6% |
| Mean | 4.1% | 2.1% |
| Median | 2.9% | 2.2% |
| Interquartile 25% (IQ1) | 2.5% | 1.5% |
| Interquartile 75% (IQ3) | 4.7% | 2.4% |
| Interquartile Range (IQR) | 2.2% | 0.92% |
| Standard Deviation (Sample) | 3.1% | 0.75% |
| Standard Deviation (Population) | 3.1% | 0.74% |
Similar Demographics by Vision Disability
Demographics Similar to French by Vision Disability
In terms of vision disability, the demographic groups most similar to French are Guatemalan (2.3%, a difference of 0.040%), Subsaharan African (2.3%, a difference of 0.060%), Liberian (2.3%, a difference of 0.070%), Alsatian (2.3%, a difference of 0.15%), and Bangladeshi (2.3%, a difference of 0.15%).
| Demographics | Rating | Rank | Vision Disability |
| English | 1.1 /100 | #239 | Tragic 2.3% |
| Panamanians | 0.9 /100 | #240 | Tragic 2.3% |
| Malaysians | 0.9 /100 | #241 | Tragic 2.3% |
| Immigrants | Panama | 0.8 /100 | #242 | Tragic 2.3% |
| Immigrants | Nicaragua | 0.6 /100 | #243 | Tragic 2.3% |
| Immigrants | West Indies | 0.6 /100 | #244 | Tragic 2.3% |
| Alsatians | 0.6 /100 | #245 | Tragic 2.3% |
| French | 0.5 /100 | #246 | Tragic 2.3% |
| Guatemalans | 0.5 /100 | #247 | Tragic 2.3% |
| Sub-Saharan Africans | 0.5 /100 | #248 | Tragic 2.3% |
| Liberians | 0.5 /100 | #249 | Tragic 2.3% |
| Bangladeshis | 0.5 /100 | #250 | Tragic 2.3% |
| Immigrants | Laos | 0.4 /100 | #251 | Tragic 2.4% |
| Immigrants | Micronesia | 0.3 /100 | #252 | Tragic 2.4% |
| Japanese | 0.3 /100 | #253 | Tragic 2.4% |
Demographics Similar to Trinidadians and Tobagonians by Vision Disability
In terms of vision disability, the demographic groups most similar to Trinidadians and Tobagonians are Immigrants from Ghana (2.2%, a difference of 0.13%), Bermudan (2.2%, a difference of 0.14%), Nigerian (2.3%, a difference of 0.21%), Indonesian (2.2%, a difference of 0.23%), and Immigrants from Trinidad and Tobago (2.3%, a difference of 0.50%).
| Demographics | Rating | Rank | Vision Disability |
| Immigrants | Nigeria | 13.5 /100 | #207 | Poor 2.2% |
| Germans | 13.4 /100 | #208 | Poor 2.2% |
| Immigrants | Brazil | 13.1 /100 | #209 | Poor 2.2% |
| Immigrants | Uruguay | 11.5 /100 | #210 | Poor 2.2% |
| Indonesians | 9.5 /100 | #211 | Tragic 2.2% |
| Bermudans | 9.0 /100 | #212 | Tragic 2.2% |
| Immigrants | Ghana | 8.9 /100 | #213 | Tragic 2.2% |
| Trinidadians and Tobagonians | 8.2 /100 | #214 | Tragic 2.2% |
| Nigerians | 7.2 /100 | #215 | Tragic 2.3% |
| Immigrants | Trinidad and Tobago | 6.1 /100 | #216 | Tragic 2.3% |
| Barbadians | 5.1 /100 | #217 | Tragic 2.3% |
| Portuguese | 4.9 /100 | #218 | Tragic 2.3% |
| Ecuadorians | 4.6 /100 | #219 | Tragic 2.3% |
| Guamanians/Chamorros | 3.9 /100 | #220 | Tragic 2.3% |
| French Canadians | 3.9 /100 | #221 | Tragic 2.3% |