Pima vs Immigrants from Venezuela Vision Disability
COMPARE
Pima
Immigrants from Venezuela
Vision Disability
Vision Disability Comparison
Pima
Immigrants from Venezuela
3.3%
VISION DISABILITY
0.0/ 100
METRIC RATING
343rd/ 347
METRIC RANK
2.1%
VISION DISABILITY
89.8/ 100
METRIC RATING
125th/ 347
METRIC RANK
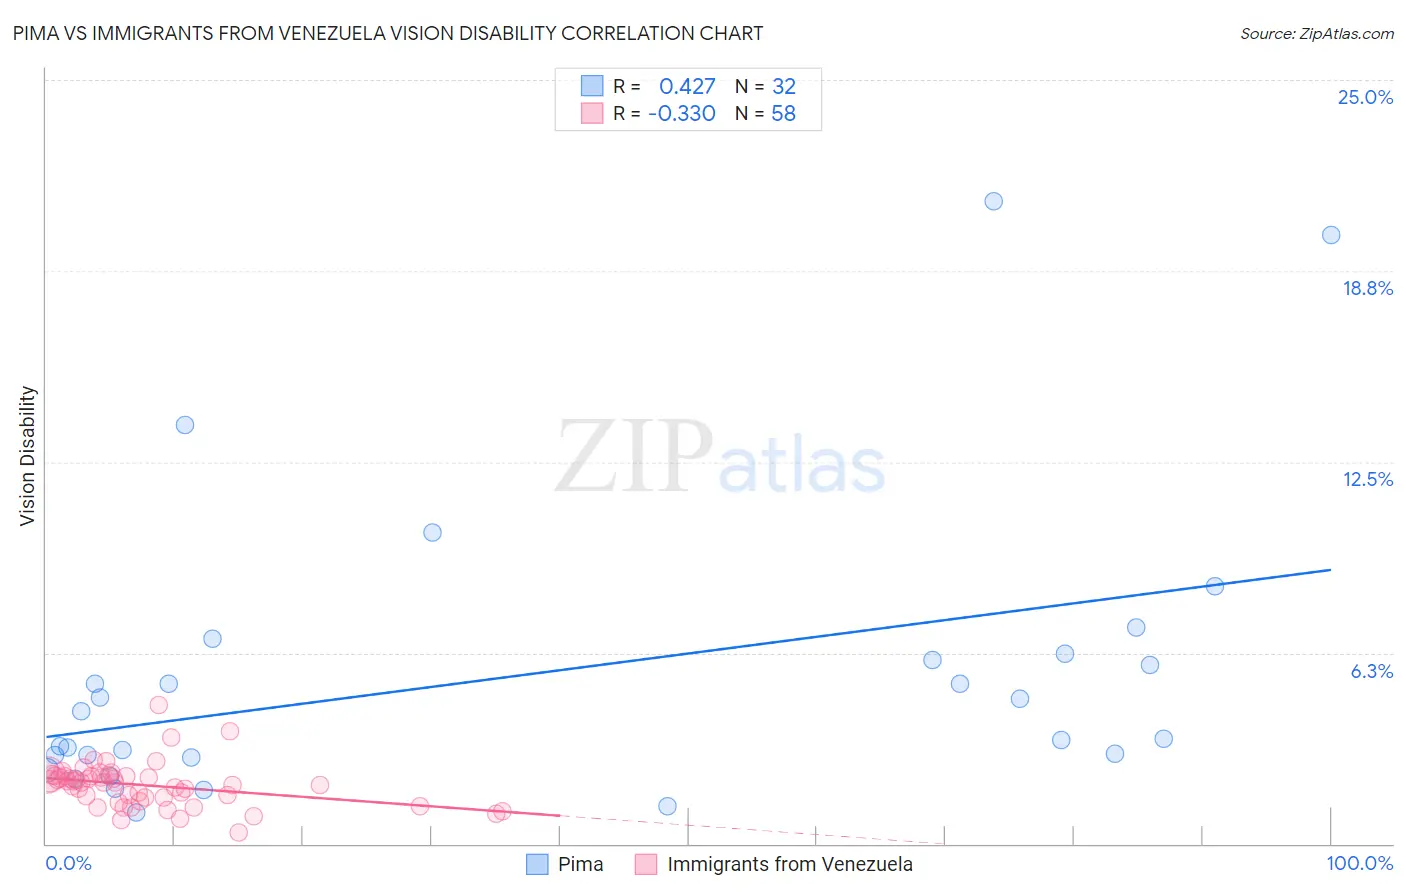
Pima vs Immigrants from Venezuela Vision Disability Correlation Chart
The statistical analysis conducted on geographies consisting of 61,535,675 people shows a moderate positive correlation between the proportion of Pima and percentage of population with vision disability in the United States with a correlation coefficient (R) of 0.427 and weighted average of 3.3%. Similarly, the statistical analysis conducted on geographies consisting of 287,771,852 people shows a mild negative correlation between the proportion of Immigrants from Venezuela and percentage of population with vision disability in the United States with a correlation coefficient (R) of -0.330 and weighted average of 2.1%, a difference of 59.2%.
Vision Disability Correlation Summary
| Measurement | Pima | Immigrants from Venezuela |
| Minimum | 1.0% | 0.36% |
| Maximum | 21.0% | 4.6% |
| Range | 20.0% | 4.2% |
| Mean | 5.5% | 1.9% |
| Median | 3.9% | 2.0% |
| Interquartile 25% (IQ1) | 2.9% | 1.5% |
| Interquartile 75% (IQ3) | 6.1% | 2.2% |
| Interquartile Range (IQR) | 3.3% | 0.71% |
| Standard Deviation (Sample) | 4.8% | 0.71% |
| Standard Deviation (Population) | 4.7% | 0.70% |
Similar Demographics by Vision Disability
Demographics Similar to Pima by Vision Disability
In terms of vision disability, the demographic groups most similar to Pima are Pueblo (3.3%, a difference of 0.030%), Choctaw (3.3%, a difference of 1.1%), Lumbee (3.4%, a difference of 1.6%), Kiowa (3.3%, a difference of 2.5%), and Houma (3.4%, a difference of 3.3%).
| Demographics | Rating | Rank | Vision Disability |
| Cajuns | 0.0 /100 | #333 | Tragic 3.1% |
| Cheyenne | 0.0 /100 | #334 | Tragic 3.1% |
| Navajo | 0.0 /100 | #335 | Tragic 3.1% |
| Alaskan Athabascans | 0.0 /100 | #336 | Tragic 3.1% |
| Dutch West Indians | 0.0 /100 | #337 | Tragic 3.2% |
| Chickasaw | 0.0 /100 | #338 | Tragic 3.2% |
| Tsimshian | 0.0 /100 | #339 | Tragic 3.2% |
| Creek | 0.0 /100 | #340 | Tragic 3.2% |
| Kiowa | 0.0 /100 | #341 | Tragic 3.3% |
| Choctaw | 0.0 /100 | #342 | Tragic 3.3% |
| Pima | 0.0 /100 | #343 | Tragic 3.3% |
| Pueblo | 0.0 /100 | #344 | Tragic 3.3% |
| Lumbee | 0.0 /100 | #345 | Tragic 3.4% |
| Houma | 0.0 /100 | #346 | Tragic 3.4% |
| Puerto Ricans | 0.0 /100 | #347 | Tragic 3.9% |
Demographics Similar to Immigrants from Venezuela by Vision Disability
In terms of vision disability, the demographic groups most similar to Immigrants from Venezuela are Immigrants from Spain (2.1%, a difference of 0.0%), Immigrants from Peru (2.1%, a difference of 0.040%), Sudanese (2.1%, a difference of 0.10%), Immigrants from Ukraine (2.1%, a difference of 0.11%), and Immigrants from Albania (2.1%, a difference of 0.11%).
| Demographics | Rating | Rank | Vision Disability |
| Immigrants | Philippines | 91.4 /100 | #118 | Exceptional 2.1% |
| Immigrants | Uganda | 91.4 /100 | #119 | Exceptional 2.1% |
| Immigrants | Zimbabwe | 91.0 /100 | #120 | Exceptional 2.1% |
| Immigrants | Scotland | 90.4 /100 | #121 | Exceptional 2.1% |
| Immigrants | Ukraine | 90.4 /100 | #122 | Exceptional 2.1% |
| Immigrants | Albania | 90.4 /100 | #123 | Exceptional 2.1% |
| Immigrants | Spain | 89.8 /100 | #124 | Excellent 2.1% |
| Immigrants | Venezuela | 89.8 /100 | #125 | Excellent 2.1% |
| Immigrants | Peru | 89.5 /100 | #126 | Excellent 2.1% |
| Sudanese | 89.2 /100 | #127 | Excellent 2.1% |
| Immigrants | Chile | 89.0 /100 | #128 | Excellent 2.1% |
| Immigrants | Cameroon | 88.8 /100 | #129 | Excellent 2.1% |
| Immigrants | Kenya | 88.7 /100 | #130 | Excellent 2.1% |
| Immigrants | Hungary | 88.7 /100 | #131 | Excellent 2.1% |
| New Zealanders | 88.2 /100 | #132 | Excellent 2.1% |