Pima vs Trinidadian and Tobagonian High School Diploma
COMPARE
Pima
Trinidadian and Tobagonian
High School Diploma
High School Diploma Comparison
Pima
Trinidadians and Tobagonians
81.6%
HIGH SCHOOL DIPLOMA
0.0/ 100
METRIC RATING
339th/ 347
METRIC RANK
86.9%
HIGH SCHOOL DIPLOMA
0.1/ 100
METRIC RATING
272nd/ 347
METRIC RANK
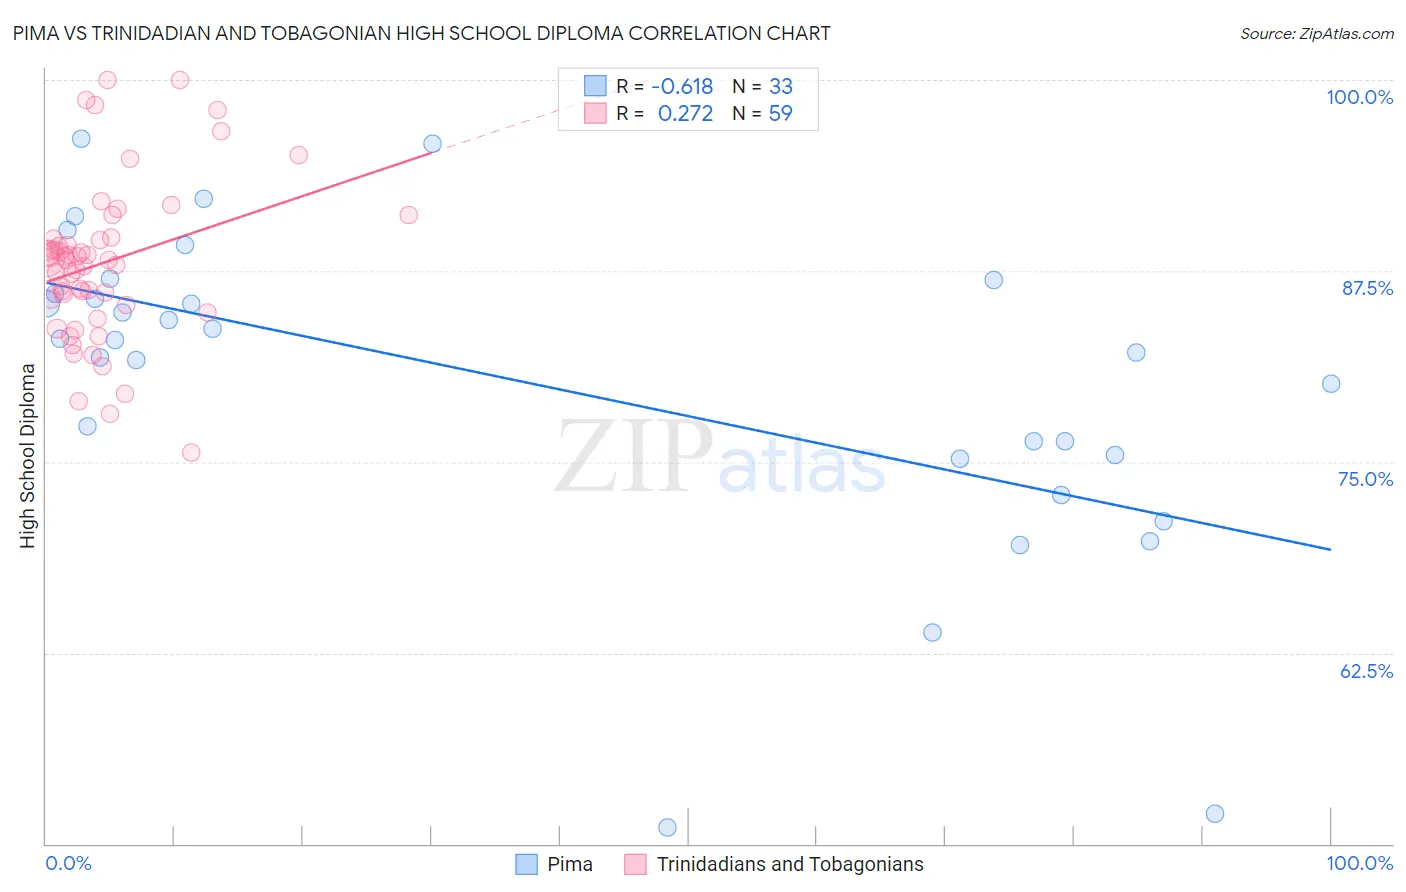
Pima vs Trinidadian and Tobagonian High School Diploma Correlation Chart
The statistical analysis conducted on geographies consisting of 61,552,828 people shows a significant negative correlation between the proportion of Pima and percentage of population with at least high school diploma education in the United States with a correlation coefficient (R) of -0.618 and weighted average of 81.6%. Similarly, the statistical analysis conducted on geographies consisting of 219,881,800 people shows a weak positive correlation between the proportion of Trinidadians and Tobagonians and percentage of population with at least high school diploma education in the United States with a correlation coefficient (R) of 0.272 and weighted average of 86.9%, a difference of 6.5%.
High School Diploma Correlation Summary
| Measurement | Pima | Trinidadian and Tobagonian |
| Minimum | 51.1% | 75.6% |
| Maximum | 96.1% | 100.0% |
| Range | 45.1% | 24.4% |
| Mean | 80.2% | 88.0% |
| Median | 83.0% | 88.2% |
| Interquartile 25% (IQ1) | 75.3% | 85.3% |
| Interquartile 75% (IQ3) | 86.4% | 89.6% |
| Interquartile Range (IQR) | 11.1% | 4.3% |
| Standard Deviation (Sample) | 10.6% | 5.2% |
| Standard Deviation (Population) | 10.4% | 5.1% |
Similar Demographics by High School Diploma
Demographics Similar to Pima by High School Diploma
In terms of high school diploma, the demographic groups most similar to Pima are Salvadoran (81.7%, a difference of 0.10%), Houma (81.5%, a difference of 0.11%), Mexican (81.4%, a difference of 0.26%), Immigrants from Yemen (81.8%, a difference of 0.27%), and Immigrants from Guatemala (81.4%, a difference of 0.31%).
| Demographics | Rating | Rank | High School Diploma |
| Immigrants | Honduras | 0.0 /100 | #332 | Tragic 82.5% |
| Immigrants | Latin America | 0.0 /100 | #333 | Tragic 82.1% |
| Tohono O'odham | 0.0 /100 | #334 | Tragic 82.1% |
| Guatemalans | 0.0 /100 | #335 | Tragic 82.0% |
| Immigrants | Dominican Republic | 0.0 /100 | #336 | Tragic 82.0% |
| Immigrants | Yemen | 0.0 /100 | #337 | Tragic 81.8% |
| Salvadorans | 0.0 /100 | #338 | Tragic 81.7% |
| Pima | 0.0 /100 | #339 | Tragic 81.6% |
| Houma | 0.0 /100 | #340 | Tragic 81.5% |
| Mexicans | 0.0 /100 | #341 | Tragic 81.4% |
| Immigrants | Guatemala | 0.0 /100 | #342 | Tragic 81.4% |
| Immigrants | El Salvador | 0.0 /100 | #343 | Tragic 80.8% |
| Immigrants | Central America | 0.0 /100 | #344 | Tragic 80.1% |
| Yakama | 0.0 /100 | #345 | Tragic 80.0% |
| Spanish American Indians | 0.0 /100 | #346 | Tragic 79.8% |
Demographics Similar to Trinidadians and Tobagonians by High School Diploma
In terms of high school diploma, the demographic groups most similar to Trinidadians and Tobagonians are West Indian (86.9%, a difference of 0.010%), Immigrants from Jamaica (86.9%, a difference of 0.030%), Bangladeshi (86.9%, a difference of 0.040%), Malaysian (87.0%, a difference of 0.070%), and Sri Lankan (87.0%, a difference of 0.090%).
| Demographics | Rating | Rank | High School Diploma |
| U.S. Virgin Islanders | 0.2 /100 | #265 | Tragic 87.1% |
| Immigrants | Congo | 0.2 /100 | #266 | Tragic 87.0% |
| Blacks/African Americans | 0.2 /100 | #267 | Tragic 87.0% |
| Pennsylvania Germans | 0.2 /100 | #268 | Tragic 87.0% |
| Sri Lankans | 0.2 /100 | #269 | Tragic 87.0% |
| Malaysians | 0.2 /100 | #270 | Tragic 87.0% |
| West Indians | 0.1 /100 | #271 | Tragic 86.9% |
| Trinidadians and Tobagonians | 0.1 /100 | #272 | Tragic 86.9% |
| Immigrants | Jamaica | 0.1 /100 | #273 | Tragic 86.9% |
| Bangladeshis | 0.1 /100 | #274 | Tragic 86.9% |
| Immigrants | Trinidad and Tobago | 0.1 /100 | #275 | Tragic 86.8% |
| Immigrants | Burma/Myanmar | 0.1 /100 | #276 | Tragic 86.7% |
| Barbadians | 0.1 /100 | #277 | Tragic 86.7% |
| Hopi | 0.1 /100 | #278 | Tragic 86.6% |
| Immigrants | Laos | 0.0 /100 | #279 | Tragic 86.6% |