Pima vs Trinidadian and Tobagonian Unemployment Among Ages 35 to 44 years
COMPARE
Pima
Trinidadian and Tobagonian
Unemployment Among Ages 35 to 44 years
Unemployment Among Ages 35 to 44 years Comparison
Pima
Trinidadians and Tobagonians
11.8%
UNEMPLOYMENT AMONG AGES 35 TO 44 YEARS
0.0/ 100
METRIC RATING
344th/ 347
METRIC RANK
5.6%
UNEMPLOYMENT AMONG AGES 35 TO 44 YEARS
0.0/ 100
METRIC RATING
294th/ 347
METRIC RANK
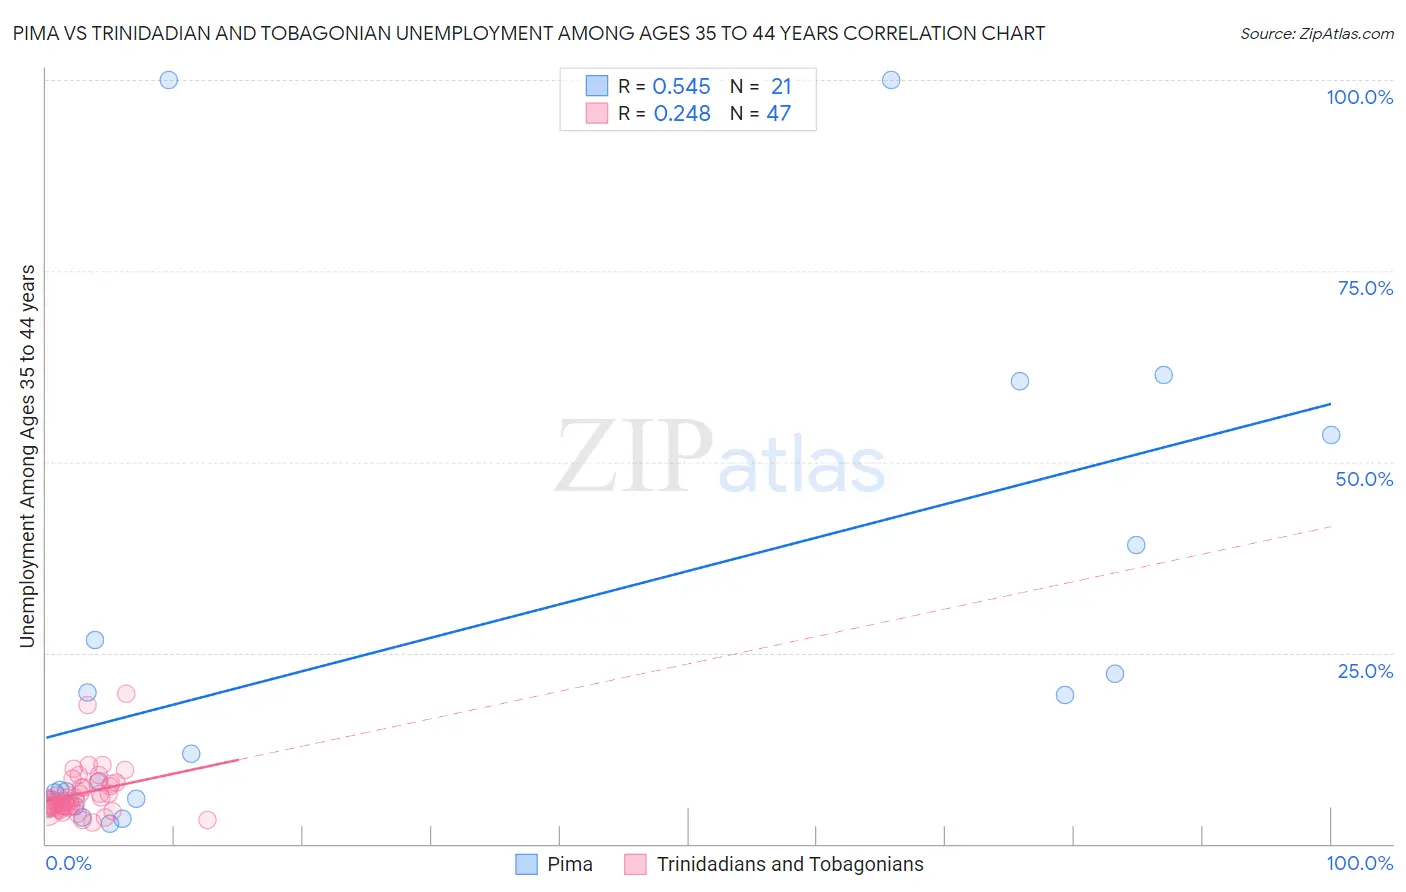
Pima vs Trinidadian and Tobagonian Unemployment Among Ages 35 to 44 years Correlation Chart
The statistical analysis conducted on geographies consisting of 61,252,012 people shows a substantial positive correlation between the proportion of Pima and unemployment rate among population between the ages 35 and 44 in the United States with a correlation coefficient (R) of 0.545 and weighted average of 11.8%. Similarly, the statistical analysis conducted on geographies consisting of 217,589,291 people shows a weak positive correlation between the proportion of Trinidadians and Tobagonians and unemployment rate among population between the ages 35 and 44 in the United States with a correlation coefficient (R) of 0.248 and weighted average of 5.6%, a difference of 111.6%.
Unemployment Among Ages 35 to 44 years Correlation Summary
| Measurement | Pima | Trinidadian and Tobagonian |
| Minimum | 2.7% | 2.8% |
| Maximum | 100.0% | 19.6% |
| Range | 97.3% | 16.8% |
| Mean | 27.1% | 6.6% |
| Median | 11.8% | 5.6% |
| Interquartile 25% (IQ1) | 5.6% | 4.8% |
| Interquartile 75% (IQ3) | 46.3% | 7.9% |
| Interquartile Range (IQR) | 40.7% | 3.1% |
| Standard Deviation (Sample) | 30.7% | 3.3% |
| Standard Deviation (Population) | 30.0% | 3.2% |
Similar Demographics by Unemployment Among Ages 35 to 44 years
Demographics Similar to Pima by Unemployment Among Ages 35 to 44 years
In terms of unemployment among ages 35 to 44 years, the demographic groups most similar to Pima are Arapaho (10.3%, a difference of 14.3%), Yup'ik (14.4%, a difference of 22.8%), Navajo (9.3%, a difference of 25.9%), Hopi (8.9%, a difference of 32.4%), and Crow (15.7%, a difference of 33.6%).
| Demographics | Rating | Rank | Unemployment Among Ages 35 to 44 years |
| Puerto Ricans | 0.0 /100 | #333 | Tragic 7.6% |
| Houma | 0.0 /100 | #334 | Tragic 7.8% |
| Sioux | 0.0 /100 | #335 | Tragic 8.4% |
| Apache | 0.0 /100 | #336 | Tragic 8.4% |
| Tohono O'odham | 0.0 /100 | #337 | Tragic 8.4% |
| Cheyenne | 0.0 /100 | #338 | Tragic 8.5% |
| Inupiat | 0.0 /100 | #339 | Tragic 8.6% |
| Alaskan Athabascans | 0.0 /100 | #340 | Tragic 8.6% |
| Hopi | 0.0 /100 | #341 | Tragic 8.9% |
| Navajo | 0.0 /100 | #342 | Tragic 9.3% |
| Arapaho | 0.0 /100 | #343 | Tragic 10.3% |
| Pima | 0.0 /100 | #344 | Tragic 11.8% |
| Yup'ik | 0.0 /100 | #345 | Tragic 14.4% |
| Crow | 0.0 /100 | #346 | Tragic 15.7% |
| Yuman | 0.0 /100 | #347 | Tragic 16.9% |
Demographics Similar to Trinidadians and Tobagonians by Unemployment Among Ages 35 to 44 years
In terms of unemployment among ages 35 to 44 years, the demographic groups most similar to Trinidadians and Tobagonians are Central American Indian (5.6%, a difference of 0.010%), Ottawa (5.6%, a difference of 0.22%), Immigrants from Haiti (5.5%, a difference of 0.23%), Immigrants from Trinidad and Tobago (5.6%, a difference of 0.23%), and U.S. Virgin Islander (5.6%, a difference of 0.34%).
| Demographics | Rating | Rank | Unemployment Among Ages 35 to 44 years |
| French American Indians | 0.0 /100 | #287 | Tragic 5.5% |
| Cree | 0.0 /100 | #288 | Tragic 5.5% |
| Spanish American Indians | 0.0 /100 | #289 | Tragic 5.5% |
| Jamaicans | 0.0 /100 | #290 | Tragic 5.5% |
| Dutch West Indians | 0.0 /100 | #291 | Tragic 5.5% |
| Immigrants | Haiti | 0.0 /100 | #292 | Tragic 5.5% |
| Central American Indians | 0.0 /100 | #293 | Tragic 5.6% |
| Trinidadians and Tobagonians | 0.0 /100 | #294 | Tragic 5.6% |
| Ottawa | 0.0 /100 | #295 | Tragic 5.6% |
| Immigrants | Trinidad and Tobago | 0.0 /100 | #296 | Tragic 5.6% |
| U.S. Virgin Islanders | 0.0 /100 | #297 | Tragic 5.6% |
| Aleuts | 0.0 /100 | #298 | Tragic 5.6% |
| Immigrants | Jamaica | 0.0 /100 | #299 | Tragic 5.6% |
| Immigrants | West Indies | 0.0 /100 | #300 | Tragic 5.6% |
| Africans | 0.0 /100 | #301 | Tragic 5.6% |