Pima vs Immigrants from Pakistan Vision Disability
COMPARE
Pima
Immigrants from Pakistan
Vision Disability
Vision Disability Comparison
Pima
Immigrants from Pakistan
3.3%
VISION DISABILITY
0.0/ 100
METRIC RATING
343rd/ 347
METRIC RANK
1.9%
VISION DISABILITY
100.0/ 100
METRIC RATING
22nd/ 347
METRIC RANK
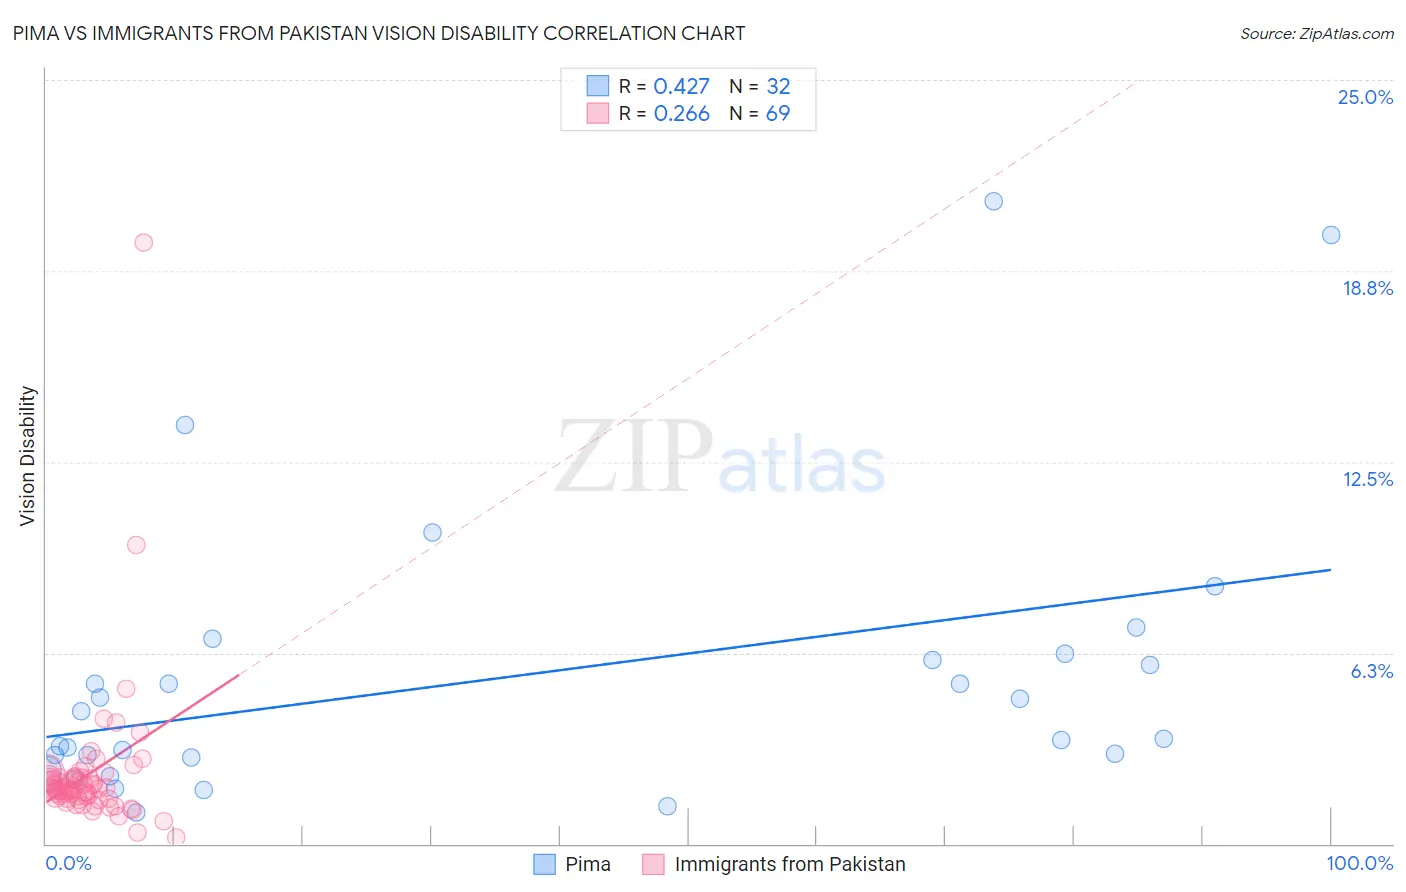
Pima vs Immigrants from Pakistan Vision Disability Correlation Chart
The statistical analysis conducted on geographies consisting of 61,535,675 people shows a moderate positive correlation between the proportion of Pima and percentage of population with vision disability in the United States with a correlation coefficient (R) of 0.427 and weighted average of 3.3%. Similarly, the statistical analysis conducted on geographies consisting of 283,768,855 people shows a weak positive correlation between the proportion of Immigrants from Pakistan and percentage of population with vision disability in the United States with a correlation coefficient (R) of 0.266 and weighted average of 1.9%, a difference of 74.7%.
Vision Disability Correlation Summary
| Measurement | Pima | Immigrants from Pakistan |
| Minimum | 1.0% | 0.21% |
| Maximum | 21.0% | 19.7% |
| Range | 20.0% | 19.5% |
| Mean | 5.5% | 2.3% |
| Median | 3.9% | 1.8% |
| Interquartile 25% (IQ1) | 2.9% | 1.5% |
| Interquartile 75% (IQ3) | 6.1% | 2.2% |
| Interquartile Range (IQR) | 3.3% | 0.69% |
| Standard Deviation (Sample) | 4.8% | 2.5% |
| Standard Deviation (Population) | 4.7% | 2.4% |
Similar Demographics by Vision Disability
Demographics Similar to Pima by Vision Disability
In terms of vision disability, the demographic groups most similar to Pima are Pueblo (3.3%, a difference of 0.030%), Choctaw (3.3%, a difference of 1.1%), Lumbee (3.4%, a difference of 1.6%), Kiowa (3.3%, a difference of 2.5%), and Houma (3.4%, a difference of 3.3%).
| Demographics | Rating | Rank | Vision Disability |
| Cajuns | 0.0 /100 | #333 | Tragic 3.1% |
| Cheyenne | 0.0 /100 | #334 | Tragic 3.1% |
| Navajo | 0.0 /100 | #335 | Tragic 3.1% |
| Alaskan Athabascans | 0.0 /100 | #336 | Tragic 3.1% |
| Dutch West Indians | 0.0 /100 | #337 | Tragic 3.2% |
| Chickasaw | 0.0 /100 | #338 | Tragic 3.2% |
| Tsimshian | 0.0 /100 | #339 | Tragic 3.2% |
| Creek | 0.0 /100 | #340 | Tragic 3.2% |
| Kiowa | 0.0 /100 | #341 | Tragic 3.3% |
| Choctaw | 0.0 /100 | #342 | Tragic 3.3% |
| Pima | 0.0 /100 | #343 | Tragic 3.3% |
| Pueblo | 0.0 /100 | #344 | Tragic 3.3% |
| Lumbee | 0.0 /100 | #345 | Tragic 3.4% |
| Houma | 0.0 /100 | #346 | Tragic 3.4% |
| Puerto Ricans | 0.0 /100 | #347 | Tragic 3.9% |
Demographics Similar to Immigrants from Pakistan by Vision Disability
In terms of vision disability, the demographic groups most similar to Immigrants from Pakistan are Turkish (1.9%, a difference of 0.050%), Asian (1.9%, a difference of 0.35%), Immigrants from Asia (1.9%, a difference of 0.54%), Immigrants from Lithuania (1.9%, a difference of 0.66%), and Bulgarian (1.9%, a difference of 0.70%).
| Demographics | Rating | Rank | Vision Disability |
| Immigrants | Bolivia | 100.0 /100 | #15 | Exceptional 1.8% |
| Indians (Asian) | 100.0 /100 | #16 | Exceptional 1.8% |
| Burmese | 100.0 /100 | #17 | Exceptional 1.8% |
| Bolivians | 100.0 /100 | #18 | Exceptional 1.9% |
| Immigrants | Sri Lanka | 100.0 /100 | #19 | Exceptional 1.9% |
| Asians | 100.0 /100 | #20 | Exceptional 1.9% |
| Turks | 100.0 /100 | #21 | Exceptional 1.9% |
| Immigrants | Pakistan | 100.0 /100 | #22 | Exceptional 1.9% |
| Immigrants | Asia | 99.9 /100 | #23 | Exceptional 1.9% |
| Immigrants | Lithuania | 99.9 /100 | #24 | Exceptional 1.9% |
| Bulgarians | 99.9 /100 | #25 | Exceptional 1.9% |
| Immigrants | Japan | 99.9 /100 | #26 | Exceptional 1.9% |
| Taiwanese | 99.9 /100 | #27 | Exceptional 1.9% |
| Immigrants | Malaysia | 99.9 /100 | #28 | Exceptional 1.9% |
| Egyptians | 99.9 /100 | #29 | Exceptional 1.9% |