Pima vs Bangladeshi Vision Disability
COMPARE
Pima
Bangladeshi
Vision Disability
Vision Disability Comparison
Pima
Bangladeshis
3.3%
VISION DISABILITY
0.0/ 100
METRIC RATING
343rd/ 347
METRIC RANK
2.3%
VISION DISABILITY
0.5/ 100
METRIC RATING
250th/ 347
METRIC RANK
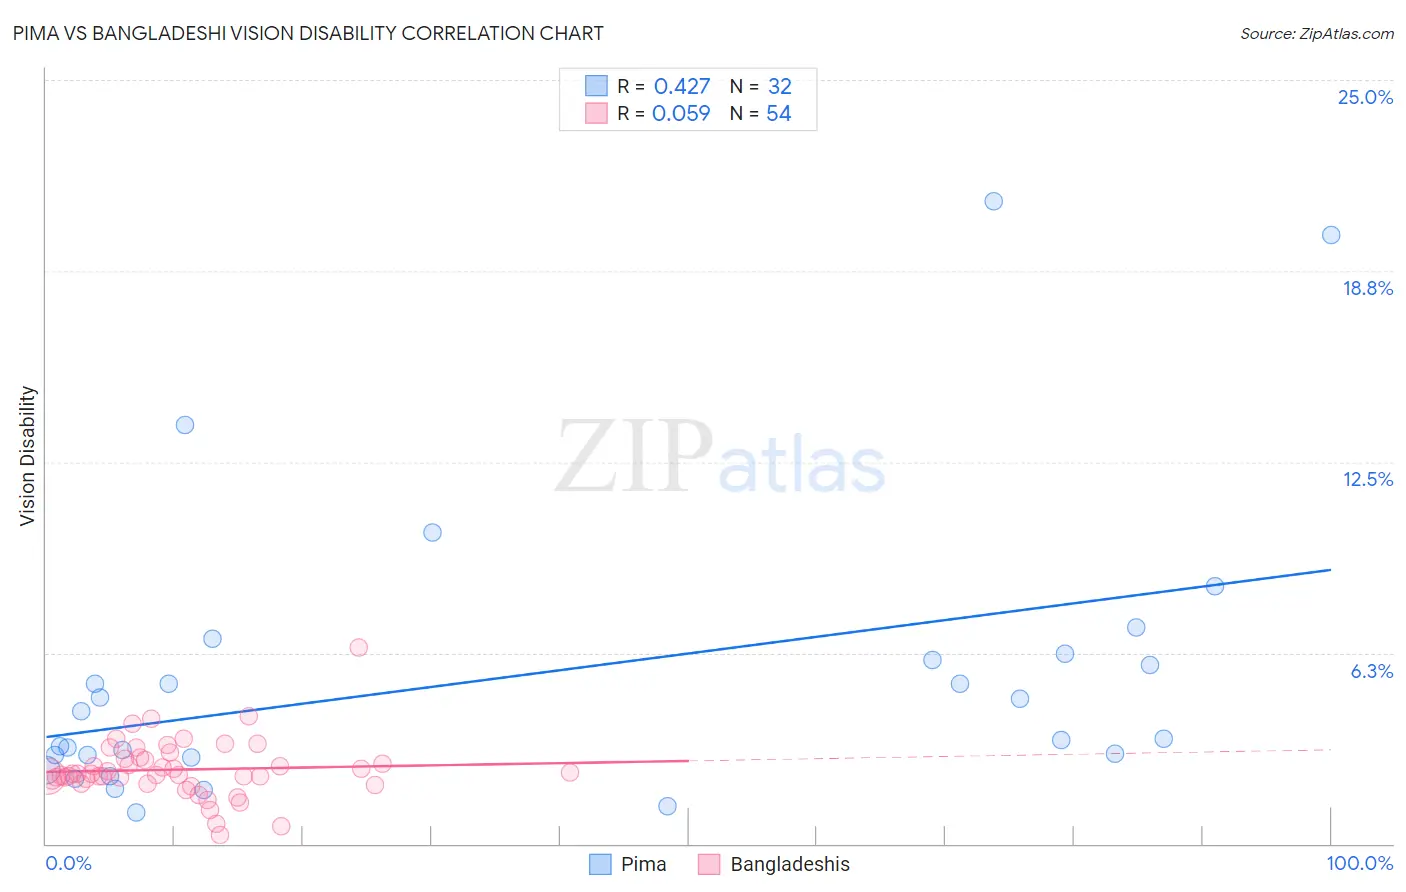
Pima vs Bangladeshi Vision Disability Correlation Chart
The statistical analysis conducted on geographies consisting of 61,535,675 people shows a moderate positive correlation between the proportion of Pima and percentage of population with vision disability in the United States with a correlation coefficient (R) of 0.427 and weighted average of 3.3%. Similarly, the statistical analysis conducted on geographies consisting of 141,342,048 people shows a slight positive correlation between the proportion of Bangladeshis and percentage of population with vision disability in the United States with a correlation coefficient (R) of 0.059 and weighted average of 2.3%, a difference of 41.8%.
Vision Disability Correlation Summary
| Measurement | Pima | Bangladeshi |
| Minimum | 1.0% | 0.30% |
| Maximum | 21.0% | 6.4% |
| Range | 20.0% | 6.1% |
| Mean | 5.5% | 2.4% |
| Median | 3.9% | 2.3% |
| Interquartile 25% (IQ1) | 2.9% | 2.1% |
| Interquartile 75% (IQ3) | 6.1% | 2.8% |
| Interquartile Range (IQR) | 3.3% | 0.72% |
| Standard Deviation (Sample) | 4.8% | 0.96% |
| Standard Deviation (Population) | 4.7% | 0.95% |
Similar Demographics by Vision Disability
Demographics Similar to Pima by Vision Disability
In terms of vision disability, the demographic groups most similar to Pima are Pueblo (3.3%, a difference of 0.030%), Choctaw (3.3%, a difference of 1.1%), Lumbee (3.4%, a difference of 1.6%), Kiowa (3.3%, a difference of 2.5%), and Houma (3.4%, a difference of 3.3%).
| Demographics | Rating | Rank | Vision Disability |
| Cajuns | 0.0 /100 | #333 | Tragic 3.1% |
| Cheyenne | 0.0 /100 | #334 | Tragic 3.1% |
| Navajo | 0.0 /100 | #335 | Tragic 3.1% |
| Alaskan Athabascans | 0.0 /100 | #336 | Tragic 3.1% |
| Dutch West Indians | 0.0 /100 | #337 | Tragic 3.2% |
| Chickasaw | 0.0 /100 | #338 | Tragic 3.2% |
| Tsimshian | 0.0 /100 | #339 | Tragic 3.2% |
| Creek | 0.0 /100 | #340 | Tragic 3.2% |
| Kiowa | 0.0 /100 | #341 | Tragic 3.3% |
| Choctaw | 0.0 /100 | #342 | Tragic 3.3% |
| Pima | 0.0 /100 | #343 | Tragic 3.3% |
| Pueblo | 0.0 /100 | #344 | Tragic 3.3% |
| Lumbee | 0.0 /100 | #345 | Tragic 3.4% |
| Houma | 0.0 /100 | #346 | Tragic 3.4% |
| Puerto Ricans | 0.0 /100 | #347 | Tragic 3.9% |
Demographics Similar to Bangladeshis by Vision Disability
In terms of vision disability, the demographic groups most similar to Bangladeshis are Liberian (2.3%, a difference of 0.080%), Subsaharan African (2.3%, a difference of 0.10%), Immigrants from Laos (2.4%, a difference of 0.11%), Guatemalan (2.3%, a difference of 0.12%), and French (2.3%, a difference of 0.15%).
| Demographics | Rating | Rank | Vision Disability |
| Immigrants | Nicaragua | 0.6 /100 | #243 | Tragic 2.3% |
| Immigrants | West Indies | 0.6 /100 | #244 | Tragic 2.3% |
| Alsatians | 0.6 /100 | #245 | Tragic 2.3% |
| French | 0.5 /100 | #246 | Tragic 2.3% |
| Guatemalans | 0.5 /100 | #247 | Tragic 2.3% |
| Sub-Saharan Africans | 0.5 /100 | #248 | Tragic 2.3% |
| Liberians | 0.5 /100 | #249 | Tragic 2.3% |
| Bangladeshis | 0.5 /100 | #250 | Tragic 2.3% |
| Immigrants | Laos | 0.4 /100 | #251 | Tragic 2.4% |
| Immigrants | Micronesia | 0.3 /100 | #252 | Tragic 2.4% |
| Japanese | 0.3 /100 | #253 | Tragic 2.4% |
| Haitians | 0.3 /100 | #254 | Tragic 2.4% |
| Immigrants | Guatemala | 0.3 /100 | #255 | Tragic 2.4% |
| Immigrants | Haiti | 0.2 /100 | #256 | Tragic 2.4% |
| West Indians | 0.2 /100 | #257 | Tragic 2.4% |