Pima vs Trinidadian and Tobagonian Bachelor's Degree
COMPARE
Pima
Trinidadian and Tobagonian
Bachelor's Degree
Bachelor's Degree Comparison
Pima
Trinidadians and Tobagonians
23.2%
BACHELOR'S DEGREE
0.0/ 100
METRIC RATING
345th/ 347
METRIC RANK
35.7%
BACHELOR'S DEGREE
8.8/ 100
METRIC RATING
222nd/ 347
METRIC RANK
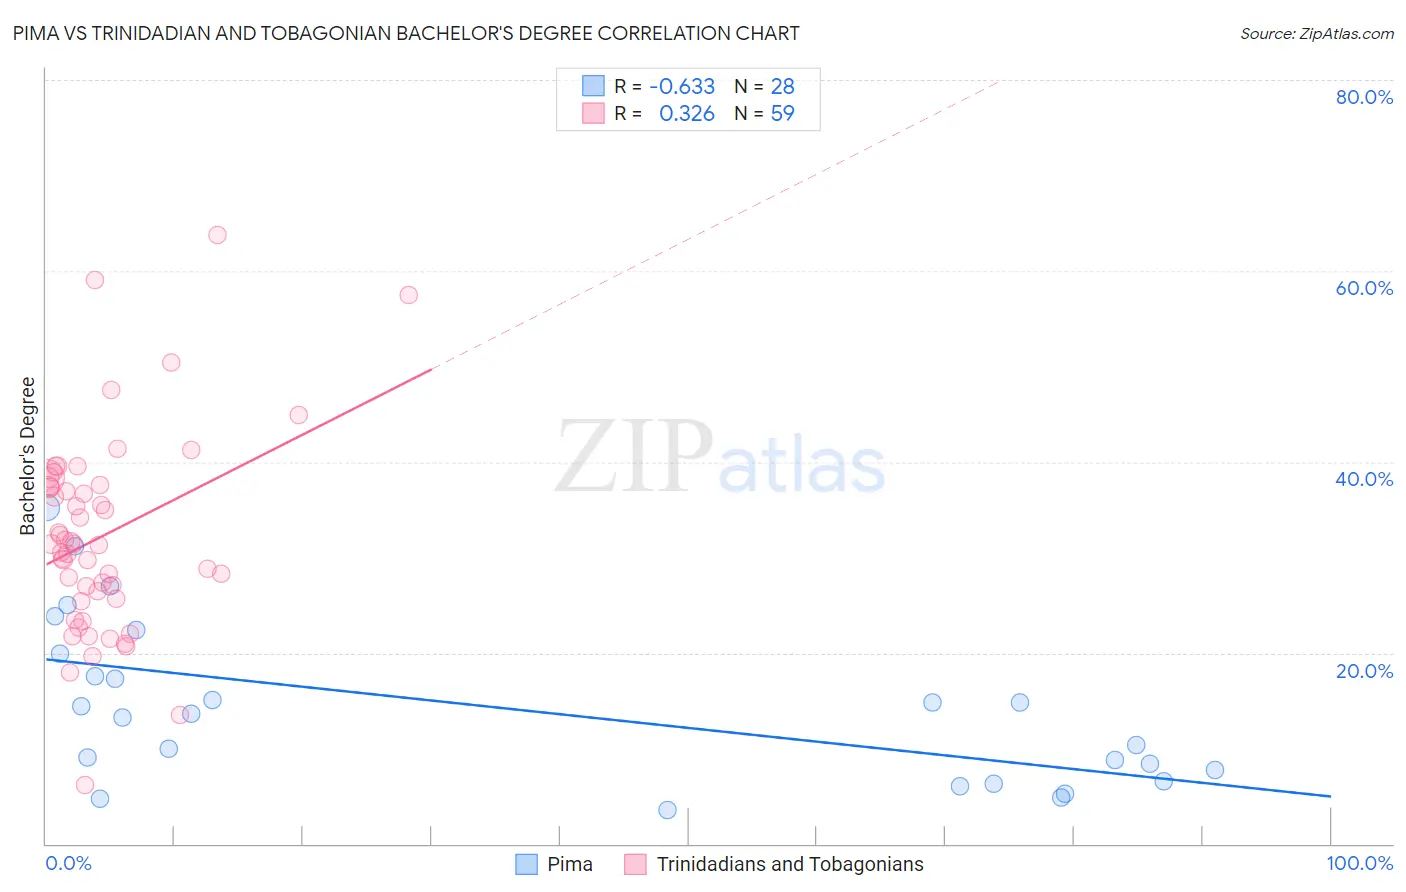
Pima vs Trinidadian and Tobagonian Bachelor's Degree Correlation Chart
The statistical analysis conducted on geographies consisting of 61,550,117 people shows a significant negative correlation between the proportion of Pima and percentage of population with at least bachelor's degree education in the United States with a correlation coefficient (R) of -0.633 and weighted average of 23.2%. Similarly, the statistical analysis conducted on geographies consisting of 219,852,585 people shows a mild positive correlation between the proportion of Trinidadians and Tobagonians and percentage of population with at least bachelor's degree education in the United States with a correlation coefficient (R) of 0.326 and weighted average of 35.7%, a difference of 53.7%.
Bachelor's Degree Correlation Summary
| Measurement | Pima | Trinidadian and Tobagonian |
| Minimum | 3.5% | 6.2% |
| Maximum | 35.2% | 63.7% |
| Range | 31.6% | 57.5% |
| Mean | 14.2% | 32.2% |
| Median | 13.4% | 31.4% |
| Interquartile 25% (IQ1) | 7.1% | 25.6% |
| Interquartile 75% (IQ3) | 18.7% | 37.5% |
| Interquartile Range (IQR) | 11.6% | 11.9% |
| Standard Deviation (Sample) | 8.5% | 10.4% |
| Standard Deviation (Population) | 8.3% | 10.4% |
Similar Demographics by Bachelor's Degree
Demographics Similar to Pima by Bachelor's Degree
In terms of bachelor's degree, the demographic groups most similar to Pima are Navajo (23.6%, a difference of 1.8%), Tohono O'odham (24.4%, a difference of 5.2%), Yakama (24.5%, a difference of 5.4%), Yuman (24.5%, a difference of 5.7%), and Lumbee (24.8%, a difference of 6.7%).
| Demographics | Rating | Rank | Bachelor's Degree |
| Mexicans | 0.0 /100 | #333 | Tragic 27.1% |
| Arapaho | 0.0 /100 | #334 | Tragic 26.6% |
| Natives/Alaskans | 0.0 /100 | #335 | Tragic 26.3% |
| Immigrants | Mexico | 0.0 /100 | #336 | Tragic 26.1% |
| Inupiat | 0.0 /100 | #337 | Tragic 25.8% |
| Pueblo | 0.0 /100 | #338 | Tragic 25.5% |
| Hopi | 0.0 /100 | #339 | Tragic 25.3% |
| Lumbee | 0.0 /100 | #340 | Tragic 24.8% |
| Yuman | 0.0 /100 | #341 | Tragic 24.5% |
| Yakama | 0.0 /100 | #342 | Tragic 24.5% |
| Tohono O'odham | 0.0 /100 | #343 | Tragic 24.4% |
| Navajo | 0.0 /100 | #344 | Tragic 23.6% |
| Pima | 0.0 /100 | #345 | Tragic 23.2% |
| Houma | 0.0 /100 | #346 | Tragic 21.4% |
| Yup'ik | 0.0 /100 | #347 | Tragic 19.4% |
Demographics Similar to Trinidadians and Tobagonians by Bachelor's Degree
In terms of bachelor's degree, the demographic groups most similar to Trinidadians and Tobagonians are Dutch (35.7%, a difference of 0.14%), French Canadian (35.6%, a difference of 0.18%), Spanish (35.8%, a difference of 0.25%), West Indian (35.8%, a difference of 0.29%), and Subsaharan African (35.8%, a difference of 0.32%).
| Demographics | Rating | Rank | Bachelor's Degree |
| Immigrants | Western Africa | 13.8 /100 | #215 | Poor 36.1% |
| Barbadians | 13.5 /100 | #216 | Poor 36.1% |
| German Russians | 10.2 /100 | #217 | Poor 35.8% |
| Sub-Saharan Africans | 9.8 /100 | #218 | Tragic 35.8% |
| West Indians | 9.7 /100 | #219 | Tragic 35.8% |
| Spanish | 9.6 /100 | #220 | Tragic 35.8% |
| Dutch | 9.2 /100 | #221 | Tragic 35.7% |
| Trinidadians and Tobagonians | 8.8 /100 | #222 | Tragic 35.7% |
| French Canadians | 8.3 /100 | #223 | Tragic 35.6% |
| Immigrants | Barbados | 7.5 /100 | #224 | Tragic 35.5% |
| Immigrants | Burma/Myanmar | 7.3 /100 | #225 | Tragic 35.5% |
| Portuguese | 7.2 /100 | #226 | Tragic 35.5% |
| Ecuadorians | 6.6 /100 | #227 | Tragic 35.4% |
| Immigrants | Trinidad and Tobago | 6.0 /100 | #228 | Tragic 35.3% |
| Whites/Caucasians | 5.9 /100 | #229 | Tragic 35.3% |