Pima vs Sri Lankan Vision Disability
COMPARE
Pima
Sri Lankan
Vision Disability
Vision Disability Comparison
Pima
Sri Lankans
3.3%
VISION DISABILITY
0.0/ 100
METRIC RATING
343rd/ 347
METRIC RANK
2.1%
VISION DISABILITY
94.8/ 100
METRIC RATING
102nd/ 347
METRIC RANK
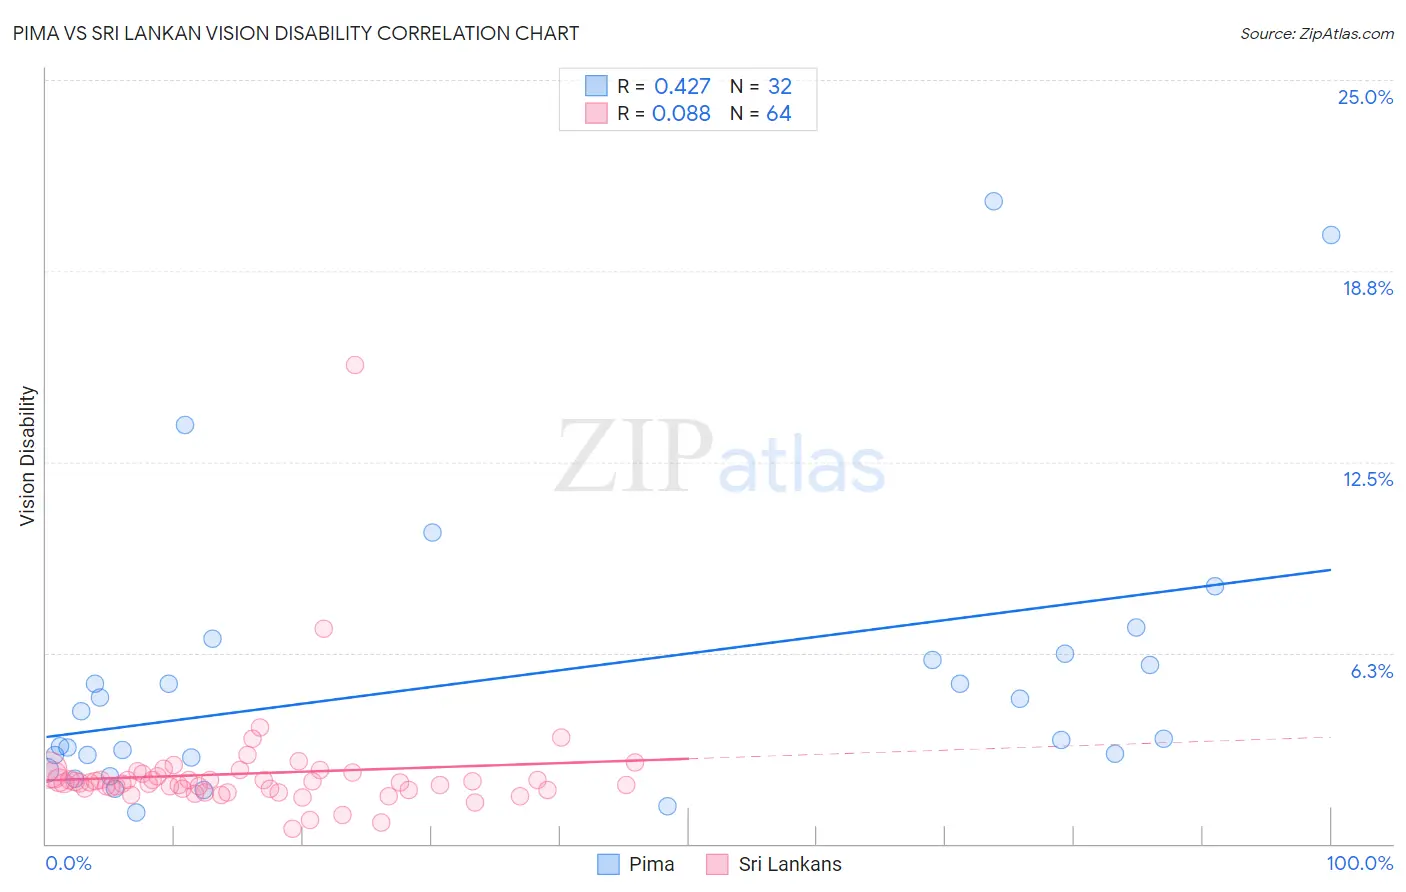
Pima vs Sri Lankan Vision Disability Correlation Chart
The statistical analysis conducted on geographies consisting of 61,535,675 people shows a moderate positive correlation between the proportion of Pima and percentage of population with vision disability in the United States with a correlation coefficient (R) of 0.427 and weighted average of 3.3%. Similarly, the statistical analysis conducted on geographies consisting of 440,158,739 people shows a slight positive correlation between the proportion of Sri Lankans and percentage of population with vision disability in the United States with a correlation coefficient (R) of 0.088 and weighted average of 2.1%, a difference of 61.2%.
Vision Disability Correlation Summary
| Measurement | Pima | Sri Lankan |
| Minimum | 1.0% | 0.49% |
| Maximum | 21.0% | 15.7% |
| Range | 20.0% | 15.2% |
| Mean | 5.5% | 2.3% |
| Median | 3.9% | 2.0% |
| Interquartile 25% (IQ1) | 2.9% | 1.8% |
| Interquartile 75% (IQ3) | 6.1% | 2.3% |
| Interquartile Range (IQR) | 3.3% | 0.48% |
| Standard Deviation (Sample) | 4.8% | 1.9% |
| Standard Deviation (Population) | 4.7% | 1.9% |
Similar Demographics by Vision Disability
Demographics Similar to Pima by Vision Disability
In terms of vision disability, the demographic groups most similar to Pima are Pueblo (3.3%, a difference of 0.030%), Choctaw (3.3%, a difference of 1.1%), Lumbee (3.4%, a difference of 1.6%), Kiowa (3.3%, a difference of 2.5%), and Houma (3.4%, a difference of 3.3%).
| Demographics | Rating | Rank | Vision Disability |
| Cajuns | 0.0 /100 | #333 | Tragic 3.1% |
| Cheyenne | 0.0 /100 | #334 | Tragic 3.1% |
| Navajo | 0.0 /100 | #335 | Tragic 3.1% |
| Alaskan Athabascans | 0.0 /100 | #336 | Tragic 3.1% |
| Dutch West Indians | 0.0 /100 | #337 | Tragic 3.2% |
| Chickasaw | 0.0 /100 | #338 | Tragic 3.2% |
| Tsimshian | 0.0 /100 | #339 | Tragic 3.2% |
| Creek | 0.0 /100 | #340 | Tragic 3.2% |
| Kiowa | 0.0 /100 | #341 | Tragic 3.3% |
| Choctaw | 0.0 /100 | #342 | Tragic 3.3% |
| Pima | 0.0 /100 | #343 | Tragic 3.3% |
| Pueblo | 0.0 /100 | #344 | Tragic 3.3% |
| Lumbee | 0.0 /100 | #345 | Tragic 3.4% |
| Houma | 0.0 /100 | #346 | Tragic 3.4% |
| Puerto Ricans | 0.0 /100 | #347 | Tragic 3.9% |
Demographics Similar to Sri Lankans by Vision Disability
In terms of vision disability, the demographic groups most similar to Sri Lankans are Albanian (2.1%, a difference of 0.030%), Greek (2.1%, a difference of 0.11%), Immigrants from Austria (2.1%, a difference of 0.14%), Estonian (2.1%, a difference of 0.15%), and Immigrants from Italy (2.1%, a difference of 0.15%).
| Demographics | Rating | Rank | Vision Disability |
| Australians | 95.9 /100 | #95 | Exceptional 2.1% |
| Romanians | 95.7 /100 | #96 | Exceptional 2.1% |
| Immigrants | Afghanistan | 95.6 /100 | #97 | Exceptional 2.1% |
| Immigrants | South Africa | 95.4 /100 | #98 | Exceptional 2.1% |
| Estonians | 95.3 /100 | #99 | Exceptional 2.1% |
| Greeks | 95.1 /100 | #100 | Exceptional 2.1% |
| Albanians | 94.9 /100 | #101 | Exceptional 2.1% |
| Sri Lankans | 94.8 /100 | #102 | Exceptional 2.1% |
| Immigrants | Austria | 94.4 /100 | #103 | Exceptional 2.1% |
| Immigrants | Italy | 94.4 /100 | #104 | Exceptional 2.1% |
| Carpatho Rusyns | 94.3 /100 | #105 | Exceptional 2.1% |
| Swedes | 94.2 /100 | #106 | Exceptional 2.1% |
| Danes | 94.2 /100 | #107 | Exceptional 2.1% |
| Koreans | 94.1 /100 | #108 | Exceptional 2.1% |
| Chileans | 94.0 /100 | #109 | Exceptional 2.1% |