Serbian vs Trinidadian and Tobagonian Vision Disability
COMPARE
Serbian
Trinidadian and Tobagonian
Vision Disability
Vision Disability Comparison
Serbians
Trinidadians and Tobagonians
2.1%
VISION DISABILITY
70.2/ 100
METRIC RATING
157th/ 347
METRIC RANK
2.2%
VISION DISABILITY
8.2/ 100
METRIC RATING
214th/ 347
METRIC RANK
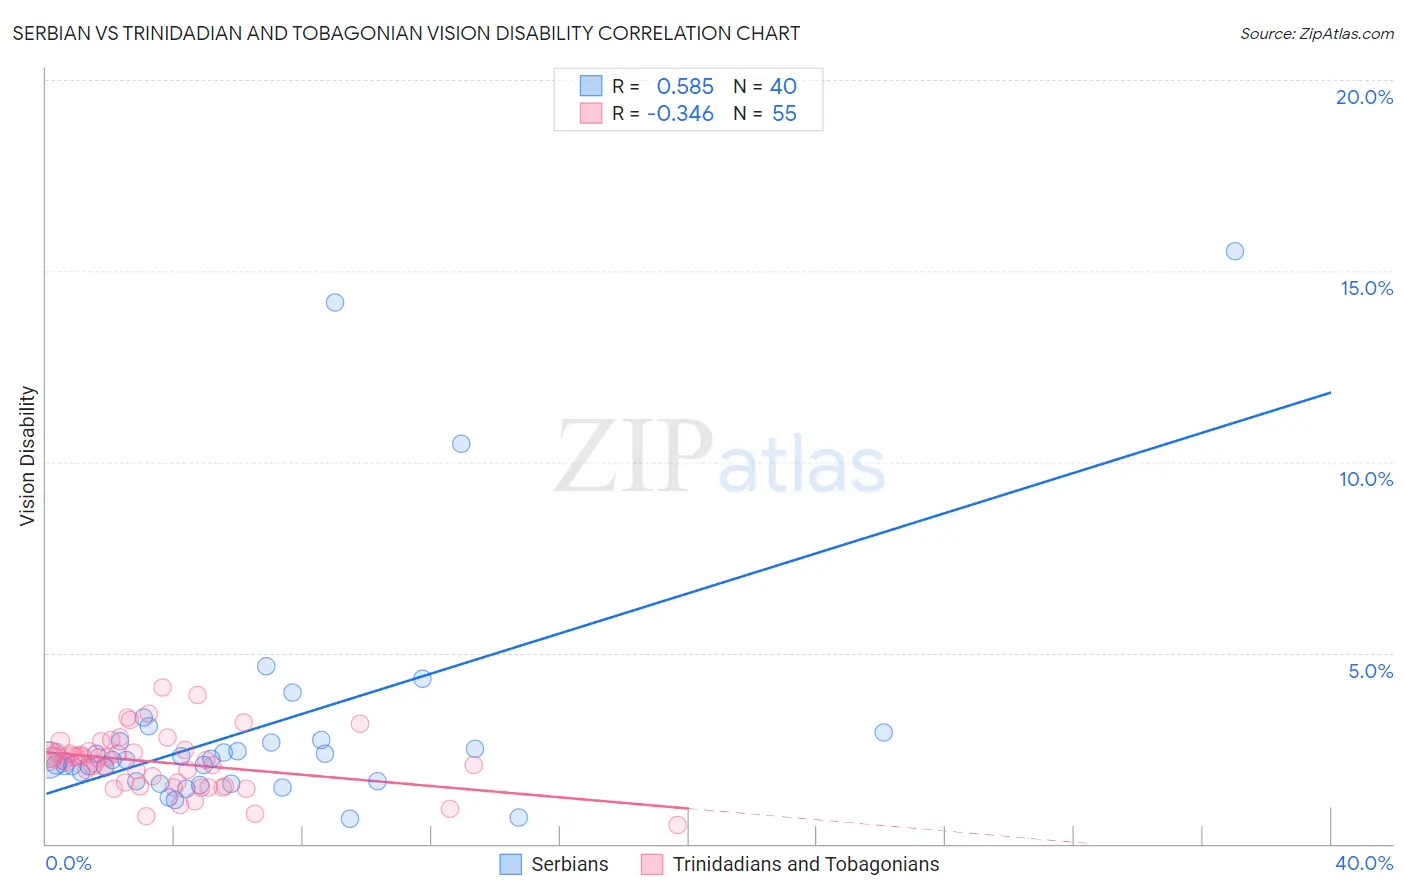
Serbian vs Trinidadian and Tobagonian Vision Disability Correlation Chart
The statistical analysis conducted on geographies consisting of 267,561,592 people shows a substantial positive correlation between the proportion of Serbians and percentage of population with vision disability in the United States with a correlation coefficient (R) of 0.585 and weighted average of 2.1%. Similarly, the statistical analysis conducted on geographies consisting of 219,745,653 people shows a mild negative correlation between the proportion of Trinidadians and Tobagonians and percentage of population with vision disability in the United States with a correlation coefficient (R) of -0.346 and weighted average of 2.2%, a difference of 5.2%.
Vision Disability Correlation Summary
| Measurement | Serbian | Trinidadian and Tobagonian |
| Minimum | 0.66% | 0.49% |
| Maximum | 15.5% | 4.1% |
| Range | 14.8% | 3.6% |
| Mean | 3.1% | 2.1% |
| Median | 2.2% | 2.2% |
| Interquartile 25% (IQ1) | 1.6% | 1.5% |
| Interquartile 75% (IQ3) | 2.7% | 2.4% |
| Interquartile Range (IQR) | 1.1% | 0.92% |
| Standard Deviation (Sample) | 3.1% | 0.75% |
| Standard Deviation (Population) | 3.1% | 0.74% |
Similar Demographics by Vision Disability
Demographics Similar to Serbians by Vision Disability
In terms of vision disability, the demographic groups most similar to Serbians are Immigrants from Uzbekistan (2.1%, a difference of 0.030%), South African (2.1%, a difference of 0.030%), Austrian (2.1%, a difference of 0.090%), Pakistani (2.1%, a difference of 0.11%), and Immigrants from Colombia (2.1%, a difference of 0.14%).
| Demographics | Rating | Rank | Vision Disability |
| Belgians | 75.9 /100 | #150 | Good 2.1% |
| Immigrants | Norway | 75.5 /100 | #151 | Good 2.1% |
| Immigrants | Southern Europe | 74.6 /100 | #152 | Good 2.1% |
| Immigrants | South America | 73.8 /100 | #153 | Good 2.1% |
| Slovenes | 73.6 /100 | #154 | Good 2.1% |
| Immigrants | Colombia | 72.1 /100 | #155 | Good 2.1% |
| Pakistanis | 71.6 /100 | #156 | Good 2.1% |
| Serbians | 70.2 /100 | #157 | Good 2.1% |
| Immigrants | Uzbekistan | 69.9 /100 | #158 | Good 2.1% |
| South Africans | 69.8 /100 | #159 | Good 2.1% |
| Austrians | 69.0 /100 | #160 | Good 2.1% |
| Iraqis | 67.7 /100 | #161 | Good 2.1% |
| Hungarians | 67.4 /100 | #162 | Good 2.1% |
| Icelanders | 66.1 /100 | #163 | Good 2.1% |
| Immigrants | Bangladesh | 65.5 /100 | #164 | Good 2.1% |
Demographics Similar to Trinidadians and Tobagonians by Vision Disability
In terms of vision disability, the demographic groups most similar to Trinidadians and Tobagonians are Immigrants from Ghana (2.2%, a difference of 0.13%), Bermudan (2.2%, a difference of 0.14%), Nigerian (2.3%, a difference of 0.21%), Indonesian (2.2%, a difference of 0.23%), and Immigrants from Trinidad and Tobago (2.3%, a difference of 0.50%).
| Demographics | Rating | Rank | Vision Disability |
| Immigrants | Nigeria | 13.5 /100 | #207 | Poor 2.2% |
| Germans | 13.4 /100 | #208 | Poor 2.2% |
| Immigrants | Brazil | 13.1 /100 | #209 | Poor 2.2% |
| Immigrants | Uruguay | 11.5 /100 | #210 | Poor 2.2% |
| Indonesians | 9.5 /100 | #211 | Tragic 2.2% |
| Bermudans | 9.0 /100 | #212 | Tragic 2.2% |
| Immigrants | Ghana | 8.9 /100 | #213 | Tragic 2.2% |
| Trinidadians and Tobagonians | 8.2 /100 | #214 | Tragic 2.2% |
| Nigerians | 7.2 /100 | #215 | Tragic 2.3% |
| Immigrants | Trinidad and Tobago | 6.1 /100 | #216 | Tragic 2.3% |
| Barbadians | 5.1 /100 | #217 | Tragic 2.3% |
| Portuguese | 4.9 /100 | #218 | Tragic 2.3% |
| Ecuadorians | 4.6 /100 | #219 | Tragic 2.3% |
| Guamanians/Chamorros | 3.9 /100 | #220 | Tragic 2.3% |
| French Canadians | 3.9 /100 | #221 | Tragic 2.3% |