Jordanian vs South American Indian Ambulatory Disability
COMPARE
Jordanian
South American Indian
Ambulatory Disability
Ambulatory Disability Comparison
Jordanians
South American Indians
5.6%
AMBULATORY DISABILITY
99.8/ 100
METRIC RATING
52nd/ 347
METRIC RANK
5.9%
AMBULATORY DISABILITY
94.8/ 100
METRIC RATING
115th/ 347
METRIC RANK
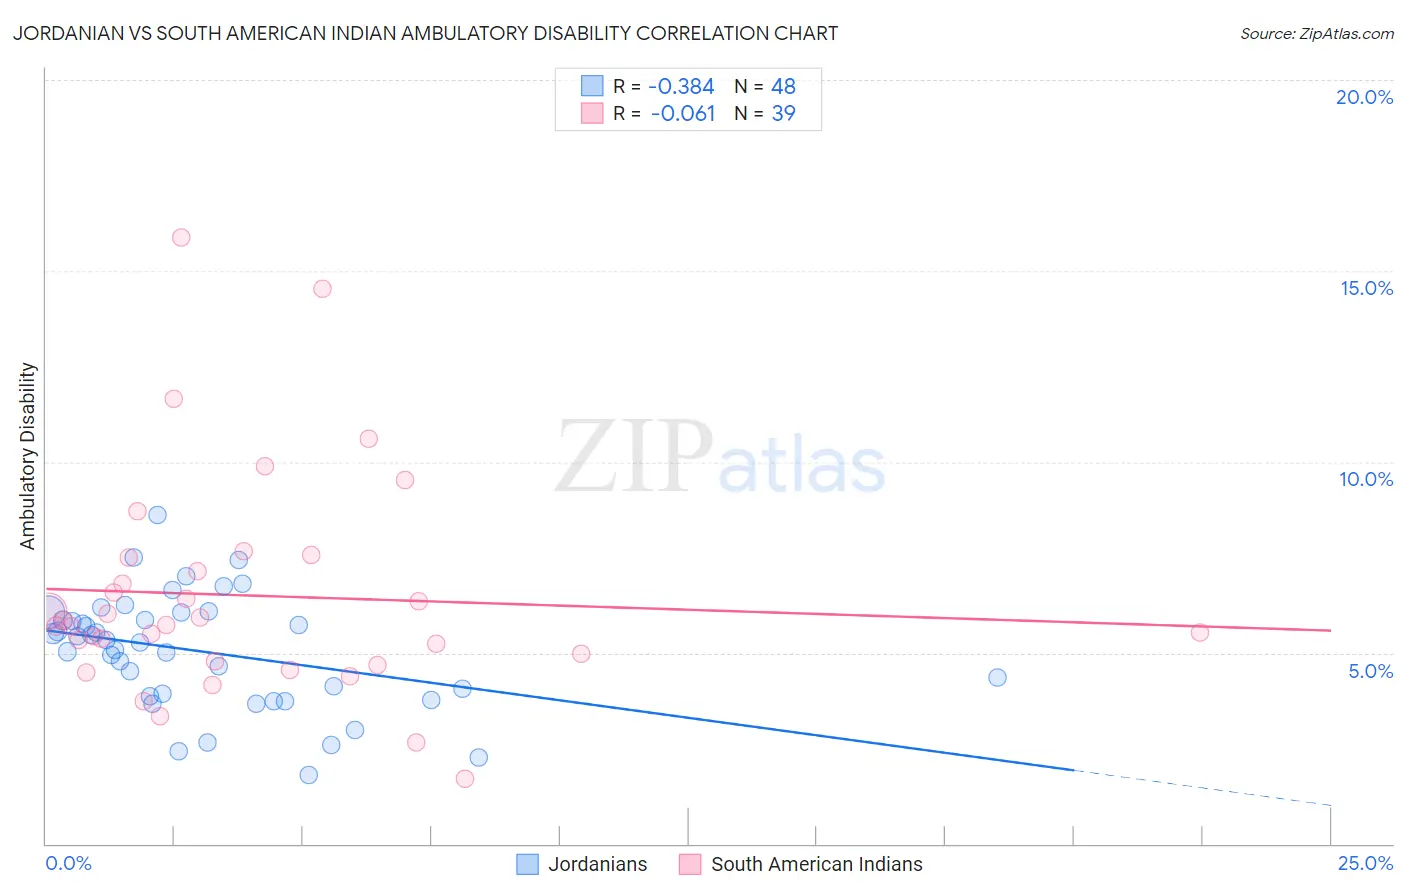
Jordanian vs South American Indian Ambulatory Disability Correlation Chart
The statistical analysis conducted on geographies consisting of 166,412,494 people shows a mild negative correlation between the proportion of Jordanians and percentage of population with ambulatory disability in the United States with a correlation coefficient (R) of -0.384 and weighted average of 5.6%. Similarly, the statistical analysis conducted on geographies consisting of 164,560,869 people shows a slight negative correlation between the proportion of South American Indians and percentage of population with ambulatory disability in the United States with a correlation coefficient (R) of -0.061 and weighted average of 5.9%, a difference of 5.1%.
Ambulatory Disability Correlation Summary
| Measurement | Jordanian | South American Indian |
| Minimum | 1.8% | 1.7% |
| Maximum | 8.6% | 15.9% |
| Range | 6.8% | 14.2% |
| Mean | 5.0% | 6.5% |
| Median | 5.3% | 5.7% |
| Interquartile 25% (IQ1) | 3.9% | 4.8% |
| Interquartile 75% (IQ3) | 5.9% | 7.5% |
| Interquartile Range (IQR) | 2.1% | 2.7% |
| Standard Deviation (Sample) | 1.5% | 2.9% |
| Standard Deviation (Population) | 1.5% | 2.9% |
Similar Demographics by Ambulatory Disability
Demographics Similar to Jordanians by Ambulatory Disability
In terms of ambulatory disability, the demographic groups most similar to Jordanians are Immigrants from Egypt (5.6%, a difference of 0.010%), Immigrants from Eastern Africa (5.6%, a difference of 0.060%), Taiwanese (5.6%, a difference of 0.090%), Immigrants from Bulgaria (5.6%, a difference of 0.12%), and Luxembourger (5.6%, a difference of 0.19%).
| Demographics | Rating | Rank | Ambulatory Disability |
| Immigrants | Sweden | 99.9 /100 | #45 | Exceptional 5.6% |
| Egyptians | 99.9 /100 | #46 | Exceptional 5.6% |
| Immigrants | Japan | 99.9 /100 | #47 | Exceptional 5.6% |
| Immigrants | Argentina | 99.9 /100 | #48 | Exceptional 5.6% |
| Bulgarians | 99.9 /100 | #49 | Exceptional 5.6% |
| Luxembourgers | 99.9 /100 | #50 | Exceptional 5.6% |
| Taiwanese | 99.8 /100 | #51 | Exceptional 5.6% |
| Jordanians | 99.8 /100 | #52 | Exceptional 5.6% |
| Immigrants | Egypt | 99.8 /100 | #53 | Exceptional 5.6% |
| Immigrants | Eastern Africa | 99.8 /100 | #54 | Exceptional 5.6% |
| Immigrants | Bulgaria | 99.8 /100 | #55 | Exceptional 5.6% |
| Inupiat | 99.8 /100 | #56 | Exceptional 5.6% |
| Immigrants | Brazil | 99.8 /100 | #57 | Exceptional 5.6% |
| Immigrants | Zimbabwe | 99.8 /100 | #58 | Exceptional 5.6% |
| Immigrants | Afghanistan | 99.8 /100 | #59 | Exceptional 5.6% |
Demographics Similar to South American Indians by Ambulatory Disability
In terms of ambulatory disability, the demographic groups most similar to South American Indians are Immigrants from Africa (5.9%, a difference of 0.010%), Immigrants from Poland (5.9%, a difference of 0.21%), Immigrants from Uruguay (5.9%, a difference of 0.26%), Immigrants from South Eastern Asia (5.9%, a difference of 0.29%), and Russian (5.9%, a difference of 0.33%).
| Demographics | Rating | Rank | Ambulatory Disability |
| Colombians | 97.2 /100 | #108 | Exceptional 5.8% |
| Immigrants | Netherlands | 97.1 /100 | #109 | Exceptional 5.8% |
| Immigrants | Colombia | 96.7 /100 | #110 | Exceptional 5.8% |
| Danes | 96.6 /100 | #111 | Exceptional 5.8% |
| South Africans | 96.3 /100 | #112 | Exceptional 5.9% |
| Immigrants | Uruguay | 95.6 /100 | #113 | Exceptional 5.9% |
| Immigrants | Poland | 95.4 /100 | #114 | Exceptional 5.9% |
| South American Indians | 94.8 /100 | #115 | Exceptional 5.9% |
| Immigrants | Africa | 94.7 /100 | #116 | Exceptional 5.9% |
| Immigrants | South Eastern Asia | 93.6 /100 | #117 | Exceptional 5.9% |
| Russians | 93.4 /100 | #118 | Exceptional 5.9% |
| Norwegians | 93.1 /100 | #119 | Exceptional 5.9% |
| Estonians | 92.9 /100 | #120 | Exceptional 5.9% |
| Costa Ricans | 92.6 /100 | #121 | Exceptional 5.9% |
| Icelanders | 92.6 /100 | #122 | Exceptional 5.9% |