Pakistani vs South American Indian Ambulatory Disability
COMPARE
Pakistani
South American Indian
Ambulatory Disability
Ambulatory Disability Comparison
Pakistanis
South American Indians
6.0%
AMBULATORY DISABILITY
82.5/ 100
METRIC RATING
145th/ 347
METRIC RANK
5.9%
AMBULATORY DISABILITY
94.8/ 100
METRIC RATING
115th/ 347
METRIC RANK
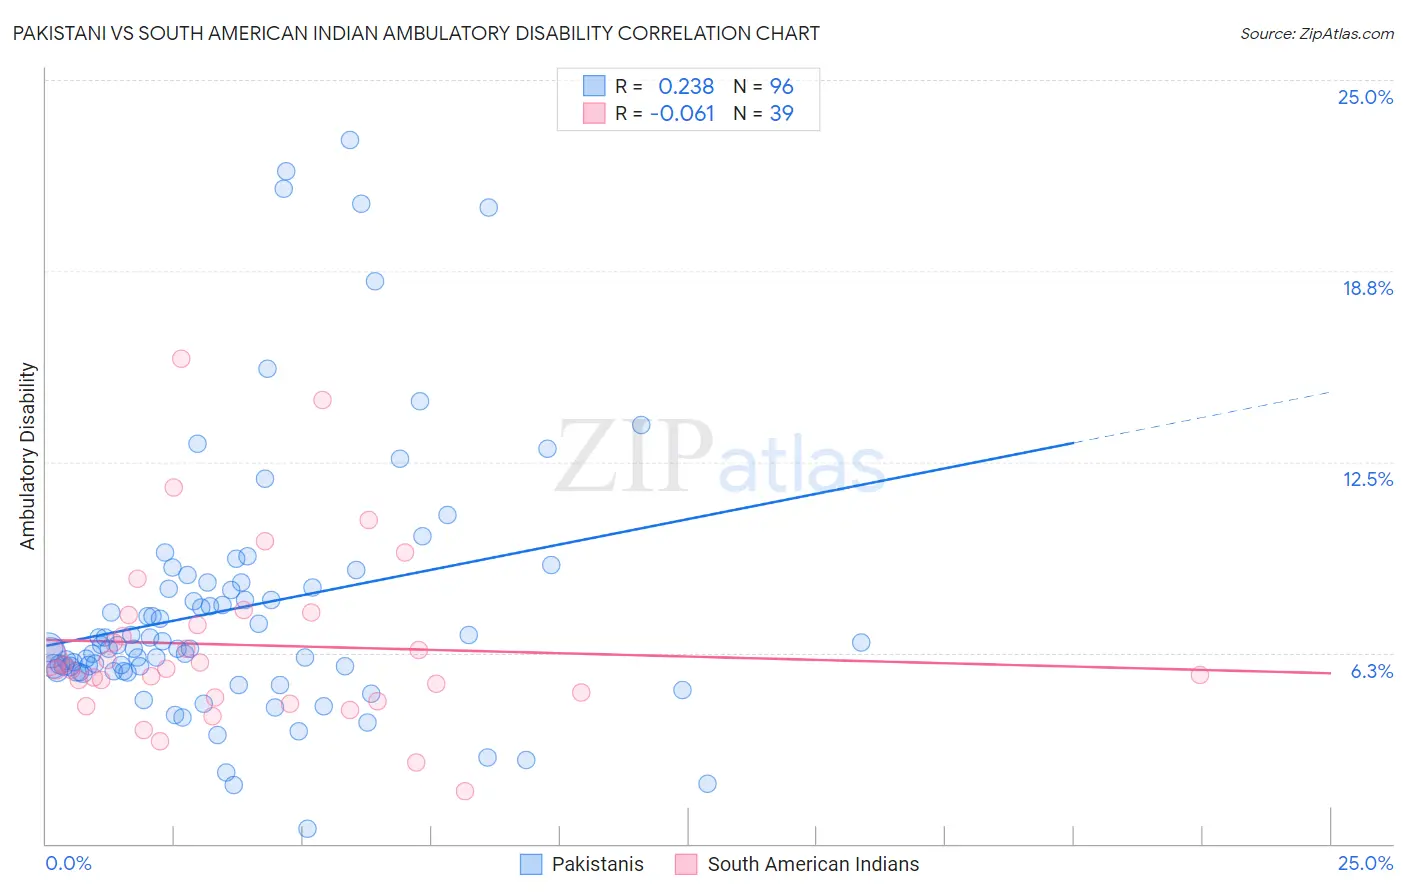
Pakistani vs South American Indian Ambulatory Disability Correlation Chart
The statistical analysis conducted on geographies consisting of 335,239,652 people shows a weak positive correlation between the proportion of Pakistanis and percentage of population with ambulatory disability in the United States with a correlation coefficient (R) of 0.238 and weighted average of 6.0%. Similarly, the statistical analysis conducted on geographies consisting of 164,560,869 people shows a slight negative correlation between the proportion of South American Indians and percentage of population with ambulatory disability in the United States with a correlation coefficient (R) of -0.061 and weighted average of 5.9%, a difference of 1.8%.
Ambulatory Disability Correlation Summary
| Measurement | Pakistani | South American Indian |
| Minimum | 0.47% | 1.7% |
| Maximum | 23.0% | 15.9% |
| Range | 22.6% | 14.2% |
| Mean | 7.7% | 6.5% |
| Median | 6.4% | 5.7% |
| Interquartile 25% (IQ1) | 5.6% | 4.8% |
| Interquartile 75% (IQ3) | 8.5% | 7.5% |
| Interquartile Range (IQR) | 2.8% | 2.7% |
| Standard Deviation (Sample) | 4.4% | 2.9% |
| Standard Deviation (Population) | 4.3% | 2.9% |
Similar Demographics by Ambulatory Disability
Demographics Similar to Pakistanis by Ambulatory Disability
In terms of ambulatory disability, the demographic groups most similar to Pakistanis are Immigrants from Greece (6.0%, a difference of 0.0%), Immigrants from Moldova (6.0%, a difference of 0.010%), Macedonian (6.0%, a difference of 0.030%), Romanian (6.0%, a difference of 0.040%), and Immigrants from Philippines (6.0%, a difference of 0.050%).
| Demographics | Rating | Rank | Ambulatory Disability |
| Immigrants | Hungary | 83.9 /100 | #138 | Excellent 6.0% |
| Immigrants | Zaire | 83.6 /100 | #139 | Excellent 6.0% |
| Czechs | 83.3 /100 | #140 | Excellent 6.0% |
| Swedes | 83.1 /100 | #141 | Excellent 6.0% |
| Immigrants | Philippines | 83.0 /100 | #142 | Excellent 6.0% |
| Romanians | 82.9 /100 | #143 | Excellent 6.0% |
| Macedonians | 82.8 /100 | #144 | Excellent 6.0% |
| Pakistanis | 82.5 /100 | #145 | Excellent 6.0% |
| Immigrants | Greece | 82.5 /100 | #146 | Excellent 6.0% |
| Immigrants | Moldova | 82.4 /100 | #147 | Excellent 6.0% |
| Immigrants | Eastern Europe | 82.0 /100 | #148 | Excellent 6.0% |
| Lithuanians | 81.9 /100 | #149 | Excellent 6.0% |
| Maltese | 81.6 /100 | #150 | Excellent 6.0% |
| Greeks | 79.6 /100 | #151 | Good 6.0% |
| Immigrants | Austria | 78.8 /100 | #152 | Good 6.0% |
Demographics Similar to South American Indians by Ambulatory Disability
In terms of ambulatory disability, the demographic groups most similar to South American Indians are Immigrants from Africa (5.9%, a difference of 0.010%), Immigrants from Poland (5.9%, a difference of 0.21%), Immigrants from Uruguay (5.9%, a difference of 0.26%), Immigrants from South Eastern Asia (5.9%, a difference of 0.29%), and Russian (5.9%, a difference of 0.33%).
| Demographics | Rating | Rank | Ambulatory Disability |
| Colombians | 97.2 /100 | #108 | Exceptional 5.8% |
| Immigrants | Netherlands | 97.1 /100 | #109 | Exceptional 5.8% |
| Immigrants | Colombia | 96.7 /100 | #110 | Exceptional 5.8% |
| Danes | 96.6 /100 | #111 | Exceptional 5.8% |
| South Africans | 96.3 /100 | #112 | Exceptional 5.9% |
| Immigrants | Uruguay | 95.6 /100 | #113 | Exceptional 5.9% |
| Immigrants | Poland | 95.4 /100 | #114 | Exceptional 5.9% |
| South American Indians | 94.8 /100 | #115 | Exceptional 5.9% |
| Immigrants | Africa | 94.7 /100 | #116 | Exceptional 5.9% |
| Immigrants | South Eastern Asia | 93.6 /100 | #117 | Exceptional 5.9% |
| Russians | 93.4 /100 | #118 | Exceptional 5.9% |
| Norwegians | 93.1 /100 | #119 | Exceptional 5.9% |
| Estonians | 92.9 /100 | #120 | Exceptional 5.9% |
| Costa Ricans | 92.6 /100 | #121 | Exceptional 5.9% |
| Icelanders | 92.6 /100 | #122 | Exceptional 5.9% |