Immigrants from Grenada vs South American Indian Ambulatory Disability
COMPARE
Immigrants from Grenada
South American Indian
Ambulatory Disability
Ambulatory Disability Comparison
Immigrants from Grenada
South American Indians
6.9%
AMBULATORY DISABILITY
0.0/ 100
METRIC RATING
298th/ 347
METRIC RANK
5.9%
AMBULATORY DISABILITY
94.8/ 100
METRIC RATING
115th/ 347
METRIC RANK
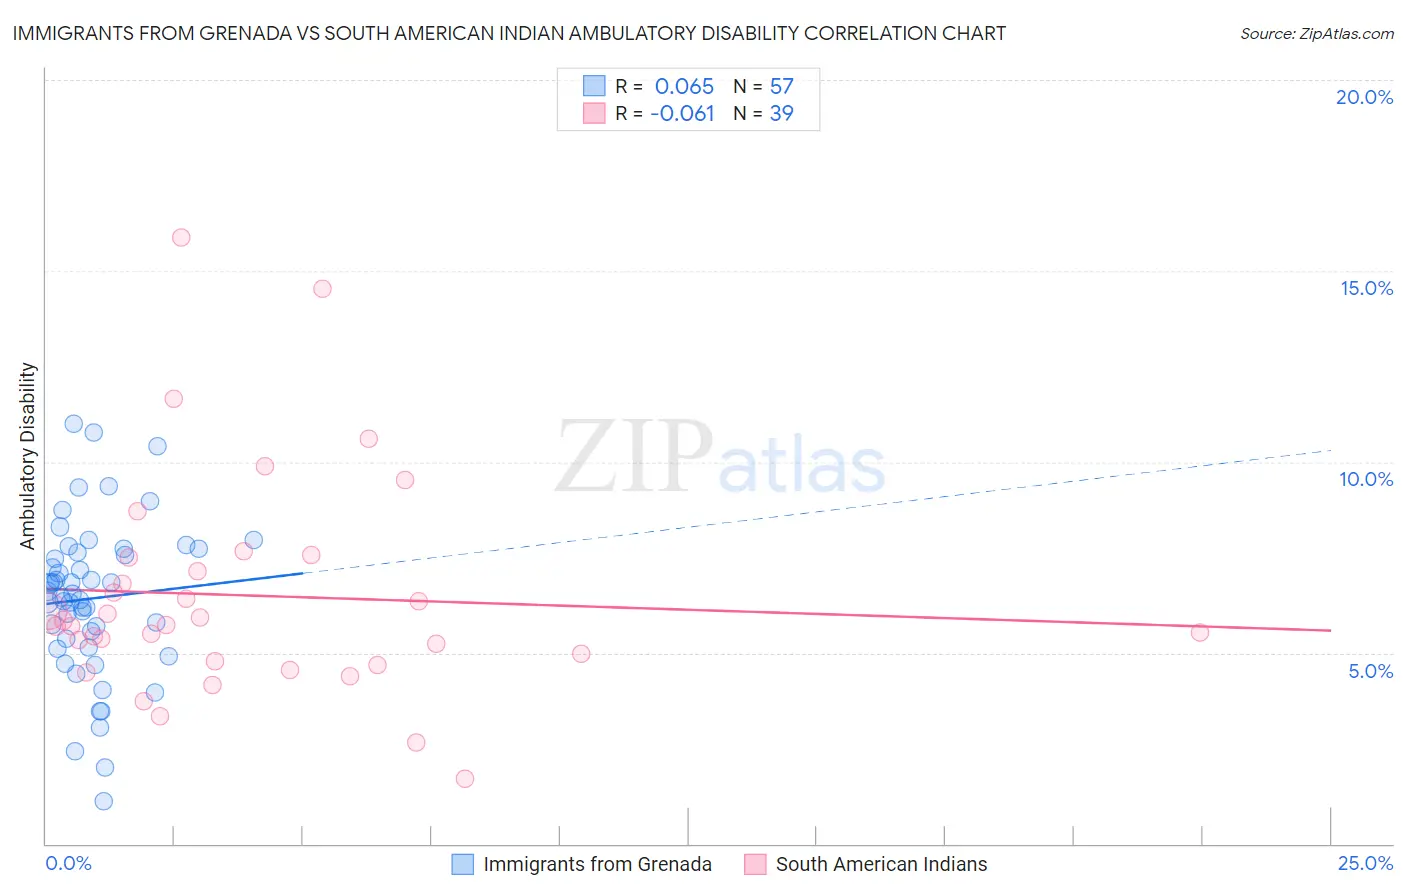
Immigrants from Grenada vs South American Indian Ambulatory Disability Correlation Chart
The statistical analysis conducted on geographies consisting of 67,197,356 people shows a slight positive correlation between the proportion of Immigrants from Grenada and percentage of population with ambulatory disability in the United States with a correlation coefficient (R) of 0.065 and weighted average of 6.9%. Similarly, the statistical analysis conducted on geographies consisting of 164,560,869 people shows a slight negative correlation between the proportion of South American Indians and percentage of population with ambulatory disability in the United States with a correlation coefficient (R) of -0.061 and weighted average of 5.9%, a difference of 17.9%.
Ambulatory Disability Correlation Summary
| Measurement | Immigrants from Grenada | South American Indian |
| Minimum | 1.1% | 1.7% |
| Maximum | 11.0% | 15.9% |
| Range | 9.9% | 14.2% |
| Mean | 6.4% | 6.5% |
| Median | 6.5% | 5.7% |
| Interquartile 25% (IQ1) | 5.2% | 4.8% |
| Interquartile 75% (IQ3) | 7.7% | 7.5% |
| Interquartile Range (IQR) | 2.4% | 2.7% |
| Standard Deviation (Sample) | 2.0% | 2.9% |
| Standard Deviation (Population) | 2.0% | 2.9% |
Similar Demographics by Ambulatory Disability
Demographics Similar to Immigrants from Grenada by Ambulatory Disability
In terms of ambulatory disability, the demographic groups most similar to Immigrants from Grenada are French American Indian (6.9%, a difference of 0.010%), Puget Sound Salish (6.9%, a difference of 0.13%), Marshallese (6.9%, a difference of 0.14%), Alaskan Athabascan (6.9%, a difference of 0.18%), and British West Indian (7.0%, a difference of 0.37%).
| Demographics | Rating | Rank | Ambulatory Disability |
| West Indians | 0.0 /100 | #291 | Tragic 6.9% |
| Cheyenne | 0.0 /100 | #292 | Tragic 6.9% |
| Immigrants | St. Vincent and the Grenadines | 0.0 /100 | #293 | Tragic 6.9% |
| Cape Verdeans | 0.0 /100 | #294 | Tragic 6.9% |
| Crow | 0.0 /100 | #295 | Tragic 6.9% |
| Alaskan Athabascans | 0.0 /100 | #296 | Tragic 6.9% |
| French American Indians | 0.0 /100 | #297 | Tragic 6.9% |
| Immigrants | Grenada | 0.0 /100 | #298 | Tragic 6.9% |
| Puget Sound Salish | 0.0 /100 | #299 | Tragic 6.9% |
| Marshallese | 0.0 /100 | #300 | Tragic 6.9% |
| British West Indians | 0.0 /100 | #301 | Tragic 7.0% |
| Immigrants | Armenia | 0.0 /100 | #302 | Tragic 7.0% |
| Africans | 0.0 /100 | #303 | Tragic 7.0% |
| Immigrants | Cabo Verde | 0.0 /100 | #304 | Tragic 7.0% |
| Immigrants | Micronesia | 0.0 /100 | #305 | Tragic 7.0% |
Demographics Similar to South American Indians by Ambulatory Disability
In terms of ambulatory disability, the demographic groups most similar to South American Indians are Immigrants from Africa (5.9%, a difference of 0.010%), Immigrants from Poland (5.9%, a difference of 0.21%), Immigrants from Uruguay (5.9%, a difference of 0.26%), Immigrants from South Eastern Asia (5.9%, a difference of 0.29%), and Russian (5.9%, a difference of 0.33%).
| Demographics | Rating | Rank | Ambulatory Disability |
| Colombians | 97.2 /100 | #108 | Exceptional 5.8% |
| Immigrants | Netherlands | 97.1 /100 | #109 | Exceptional 5.8% |
| Immigrants | Colombia | 96.7 /100 | #110 | Exceptional 5.8% |
| Danes | 96.6 /100 | #111 | Exceptional 5.8% |
| South Africans | 96.3 /100 | #112 | Exceptional 5.9% |
| Immigrants | Uruguay | 95.6 /100 | #113 | Exceptional 5.9% |
| Immigrants | Poland | 95.4 /100 | #114 | Exceptional 5.9% |
| South American Indians | 94.8 /100 | #115 | Exceptional 5.9% |
| Immigrants | Africa | 94.7 /100 | #116 | Exceptional 5.9% |
| Immigrants | South Eastern Asia | 93.6 /100 | #117 | Exceptional 5.9% |
| Russians | 93.4 /100 | #118 | Exceptional 5.9% |
| Norwegians | 93.1 /100 | #119 | Exceptional 5.9% |
| Estonians | 92.9 /100 | #120 | Exceptional 5.9% |
| Costa Ricans | 92.6 /100 | #121 | Exceptional 5.9% |
| Icelanders | 92.6 /100 | #122 | Exceptional 5.9% |