Cree vs South American Indian Ambulatory Disability
COMPARE
Cree
South American Indian
Ambulatory Disability
Ambulatory Disability Comparison
Cree
South American Indians
7.1%
AMBULATORY DISABILITY
0.0/ 100
METRIC RATING
311th/ 347
METRIC RANK
5.9%
AMBULATORY DISABILITY
94.8/ 100
METRIC RATING
115th/ 347
METRIC RANK
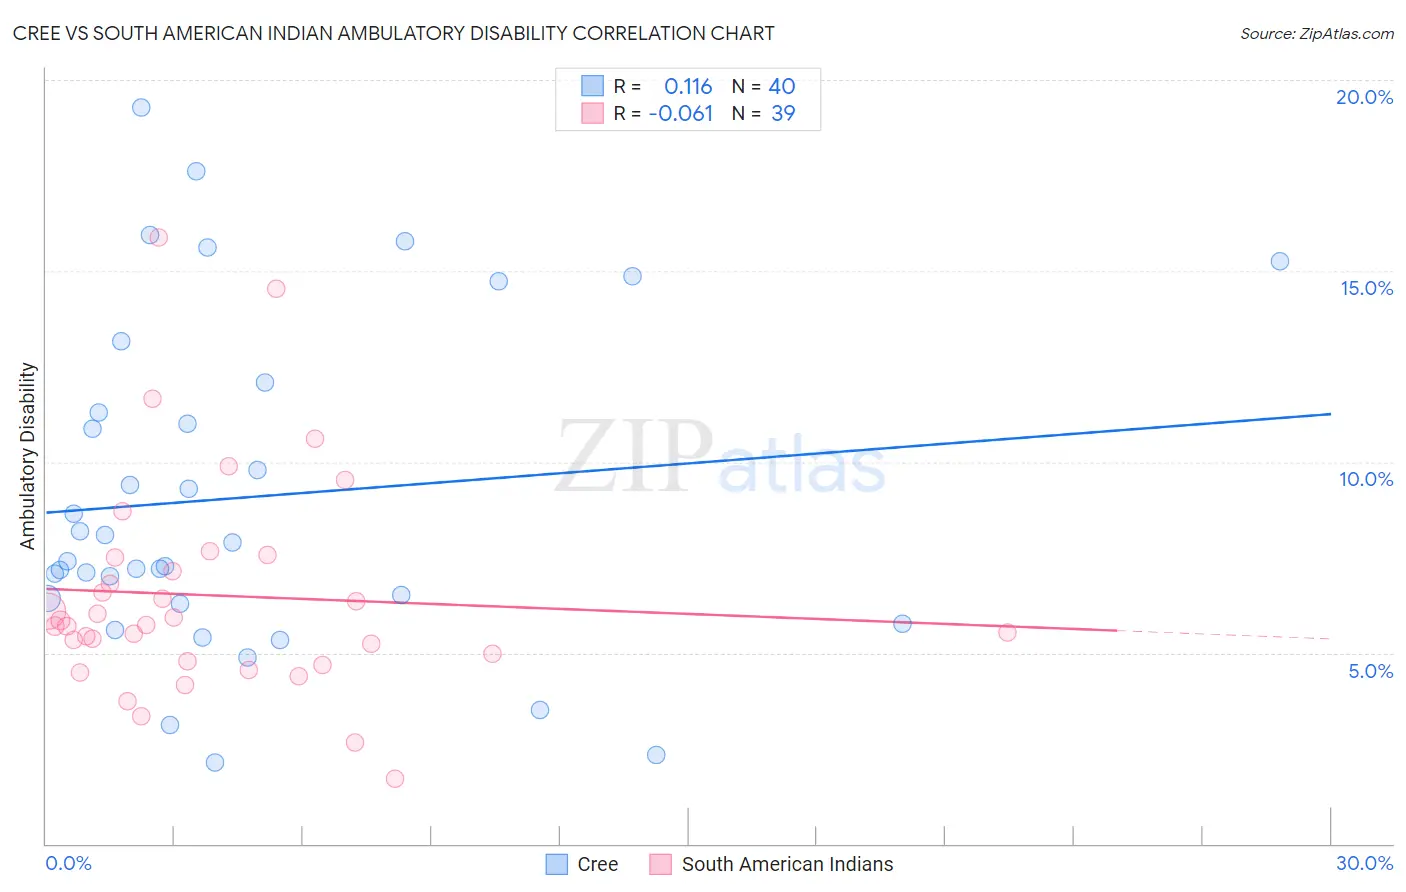
Cree vs South American Indian Ambulatory Disability Correlation Chart
The statistical analysis conducted on geographies consisting of 76,208,414 people shows a poor positive correlation between the proportion of Cree and percentage of population with ambulatory disability in the United States with a correlation coefficient (R) of 0.116 and weighted average of 7.1%. Similarly, the statistical analysis conducted on geographies consisting of 164,560,869 people shows a slight negative correlation between the proportion of South American Indians and percentage of population with ambulatory disability in the United States with a correlation coefficient (R) of -0.061 and weighted average of 5.9%, a difference of 20.7%.
Ambulatory Disability Correlation Summary
| Measurement | Cree | South American Indian |
| Minimum | 2.1% | 1.7% |
| Maximum | 19.3% | 15.9% |
| Range | 17.2% | 14.2% |
| Mean | 9.1% | 6.5% |
| Median | 7.7% | 5.7% |
| Interquartile 25% (IQ1) | 6.4% | 4.8% |
| Interquartile 75% (IQ3) | 11.7% | 7.5% |
| Interquartile Range (IQR) | 5.3% | 2.7% |
| Standard Deviation (Sample) | 4.3% | 2.9% |
| Standard Deviation (Population) | 4.3% | 2.9% |
Similar Demographics by Ambulatory Disability
Demographics Similar to Cree by Ambulatory Disability
In terms of ambulatory disability, the demographic groups most similar to Cree are Arapaho (7.1%, a difference of 0.010%), Delaware (7.1%, a difference of 0.22%), Immigrants from the Azores (7.1%, a difference of 0.29%), Immigrants from Yemen (7.1%, a difference of 0.35%), and Blackfeet (7.1%, a difference of 0.38%).
| Demographics | Rating | Rank | Ambulatory Disability |
| Immigrants | Cabo Verde | 0.0 /100 | #304 | Tragic 7.0% |
| Immigrants | Micronesia | 0.0 /100 | #305 | Tragic 7.0% |
| Iroquois | 0.0 /100 | #306 | Tragic 7.1% |
| Spanish Americans | 0.0 /100 | #307 | Tragic 7.1% |
| Chippewa | 0.0 /100 | #308 | Tragic 7.1% |
| Immigrants | Azores | 0.0 /100 | #309 | Tragic 7.1% |
| Arapaho | 0.0 /100 | #310 | Tragic 7.1% |
| Cree | 0.0 /100 | #311 | Tragic 7.1% |
| Delaware | 0.0 /100 | #312 | Tragic 7.1% |
| Immigrants | Yemen | 0.0 /100 | #313 | Tragic 7.1% |
| Blackfeet | 0.0 /100 | #314 | Tragic 7.1% |
| Shoshone | 0.0 /100 | #315 | Tragic 7.1% |
| Immigrants | Dominican Republic | 0.0 /100 | #316 | Tragic 7.1% |
| Central American Indians | 0.0 /100 | #317 | Tragic 7.2% |
| Ottawa | 0.0 /100 | #318 | Tragic 7.2% |
Demographics Similar to South American Indians by Ambulatory Disability
In terms of ambulatory disability, the demographic groups most similar to South American Indians are Immigrants from Africa (5.9%, a difference of 0.010%), Immigrants from Poland (5.9%, a difference of 0.21%), Immigrants from Uruguay (5.9%, a difference of 0.26%), Immigrants from South Eastern Asia (5.9%, a difference of 0.29%), and Russian (5.9%, a difference of 0.33%).
| Demographics | Rating | Rank | Ambulatory Disability |
| Colombians | 97.2 /100 | #108 | Exceptional 5.8% |
| Immigrants | Netherlands | 97.1 /100 | #109 | Exceptional 5.8% |
| Immigrants | Colombia | 96.7 /100 | #110 | Exceptional 5.8% |
| Danes | 96.6 /100 | #111 | Exceptional 5.8% |
| South Africans | 96.3 /100 | #112 | Exceptional 5.9% |
| Immigrants | Uruguay | 95.6 /100 | #113 | Exceptional 5.9% |
| Immigrants | Poland | 95.4 /100 | #114 | Exceptional 5.9% |
| South American Indians | 94.8 /100 | #115 | Exceptional 5.9% |
| Immigrants | Africa | 94.7 /100 | #116 | Exceptional 5.9% |
| Immigrants | South Eastern Asia | 93.6 /100 | #117 | Exceptional 5.9% |
| Russians | 93.4 /100 | #118 | Exceptional 5.9% |
| Norwegians | 93.1 /100 | #119 | Exceptional 5.9% |
| Estonians | 92.9 /100 | #120 | Exceptional 5.9% |
| Costa Ricans | 92.6 /100 | #121 | Exceptional 5.9% |
| Icelanders | 92.6 /100 | #122 | Exceptional 5.9% |