American vs South American Indian Ambulatory Disability
COMPARE
American
South American Indian
Ambulatory Disability
Ambulatory Disability Comparison
Americans
South American Indians
7.4%
AMBULATORY DISABILITY
0.0/ 100
METRIC RATING
323rd/ 347
METRIC RANK
5.9%
AMBULATORY DISABILITY
94.8/ 100
METRIC RATING
115th/ 347
METRIC RANK
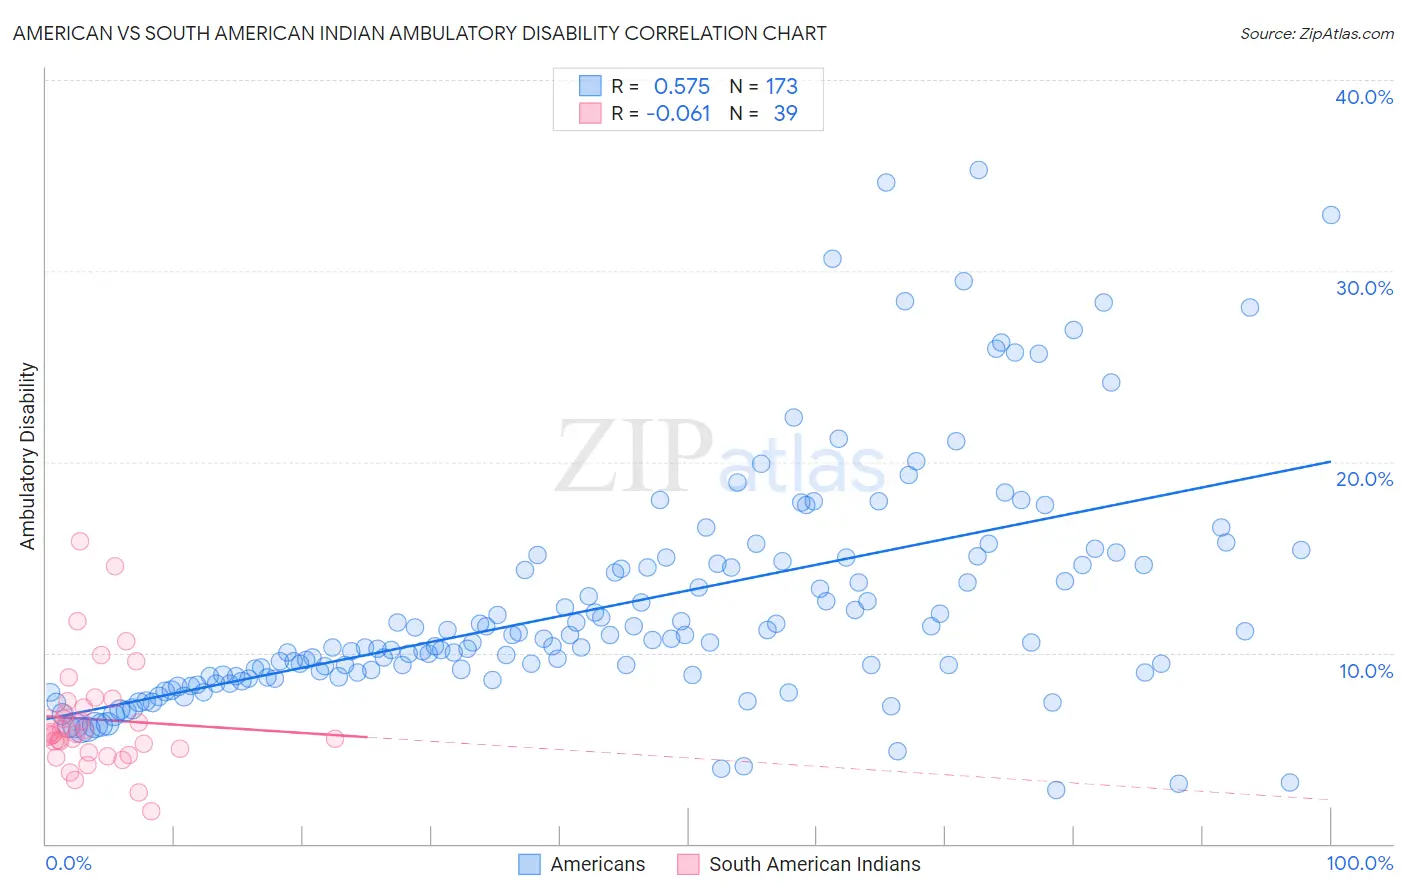
American vs South American Indian Ambulatory Disability Correlation Chart
The statistical analysis conducted on geographies consisting of 581,324,022 people shows a substantial positive correlation between the proportion of Americans and percentage of population with ambulatory disability in the United States with a correlation coefficient (R) of 0.575 and weighted average of 7.4%. Similarly, the statistical analysis conducted on geographies consisting of 164,560,869 people shows a slight negative correlation between the proportion of South American Indians and percentage of population with ambulatory disability in the United States with a correlation coefficient (R) of -0.061 and weighted average of 5.9%, a difference of 25.9%.
Ambulatory Disability Correlation Summary
| Measurement | American | South American Indian |
| Minimum | 2.8% | 1.7% |
| Maximum | 35.3% | 15.9% |
| Range | 32.5% | 14.2% |
| Mean | 12.5% | 6.5% |
| Median | 10.5% | 5.7% |
| Interquartile 25% (IQ1) | 8.8% | 4.8% |
| Interquartile 75% (IQ3) | 14.6% | 7.5% |
| Interquartile Range (IQR) | 5.9% | 2.7% |
| Standard Deviation (Sample) | 6.2% | 2.9% |
| Standard Deviation (Population) | 6.1% | 2.9% |
Similar Demographics by Ambulatory Disability
Demographics Similar to Americans by Ambulatory Disability
In terms of ambulatory disability, the demographic groups most similar to Americans are Osage (7.4%, a difference of 0.28%), Apache (7.4%, a difference of 0.42%), Potawatomi (7.3%, a difference of 1.2%), Navajo (7.5%, a difference of 1.3%), and Comanche (7.5%, a difference of 1.4%).
| Demographics | Rating | Rank | Ambulatory Disability |
| Immigrants | Dominican Republic | 0.0 /100 | #316 | Tragic 7.1% |
| Central American Indians | 0.0 /100 | #317 | Tragic 7.2% |
| Ottawa | 0.0 /100 | #318 | Tragic 7.2% |
| Dominicans | 0.0 /100 | #319 | Tragic 7.2% |
| Potawatomi | 0.0 /100 | #320 | Tragic 7.3% |
| Apache | 0.0 /100 | #321 | Tragic 7.4% |
| Osage | 0.0 /100 | #322 | Tragic 7.4% |
| Americans | 0.0 /100 | #323 | Tragic 7.4% |
| Navajo | 0.0 /100 | #324 | Tragic 7.5% |
| Comanche | 0.0 /100 | #325 | Tragic 7.5% |
| Blacks/African Americans | 0.0 /100 | #326 | Tragic 7.5% |
| Natives/Alaskans | 0.0 /100 | #327 | Tragic 7.5% |
| Hopi | 0.0 /100 | #328 | Tragic 7.6% |
| Pueblo | 0.0 /100 | #329 | Tragic 7.6% |
| Paiute | 0.0 /100 | #330 | Tragic 7.7% |
Demographics Similar to South American Indians by Ambulatory Disability
In terms of ambulatory disability, the demographic groups most similar to South American Indians are Immigrants from Africa (5.9%, a difference of 0.010%), Immigrants from Poland (5.9%, a difference of 0.21%), Immigrants from Uruguay (5.9%, a difference of 0.26%), Immigrants from South Eastern Asia (5.9%, a difference of 0.29%), and Russian (5.9%, a difference of 0.33%).
| Demographics | Rating | Rank | Ambulatory Disability |
| Colombians | 97.2 /100 | #108 | Exceptional 5.8% |
| Immigrants | Netherlands | 97.1 /100 | #109 | Exceptional 5.8% |
| Immigrants | Colombia | 96.7 /100 | #110 | Exceptional 5.8% |
| Danes | 96.6 /100 | #111 | Exceptional 5.8% |
| South Africans | 96.3 /100 | #112 | Exceptional 5.9% |
| Immigrants | Uruguay | 95.6 /100 | #113 | Exceptional 5.9% |
| Immigrants | Poland | 95.4 /100 | #114 | Exceptional 5.9% |
| South American Indians | 94.8 /100 | #115 | Exceptional 5.9% |
| Immigrants | Africa | 94.7 /100 | #116 | Exceptional 5.9% |
| Immigrants | South Eastern Asia | 93.6 /100 | #117 | Exceptional 5.9% |
| Russians | 93.4 /100 | #118 | Exceptional 5.9% |
| Norwegians | 93.1 /100 | #119 | Exceptional 5.9% |
| Estonians | 92.9 /100 | #120 | Exceptional 5.9% |
| Costa Ricans | 92.6 /100 | #121 | Exceptional 5.9% |
| Icelanders | 92.6 /100 | #122 | Exceptional 5.9% |