Pima vs Puget Sound Salish Female Disability
COMPARE
Pima
Puget Sound Salish
Female Disability
Female Disability Comparison
Pima
Puget Sound Salish
14.8%
FEMALE DISABILITY
0.0/ 100
METRIC RATING
332nd/ 347
METRIC RANK
13.8%
FEMALE DISABILITY
0.0/ 100
METRIC RATING
314th/ 347
METRIC RANK
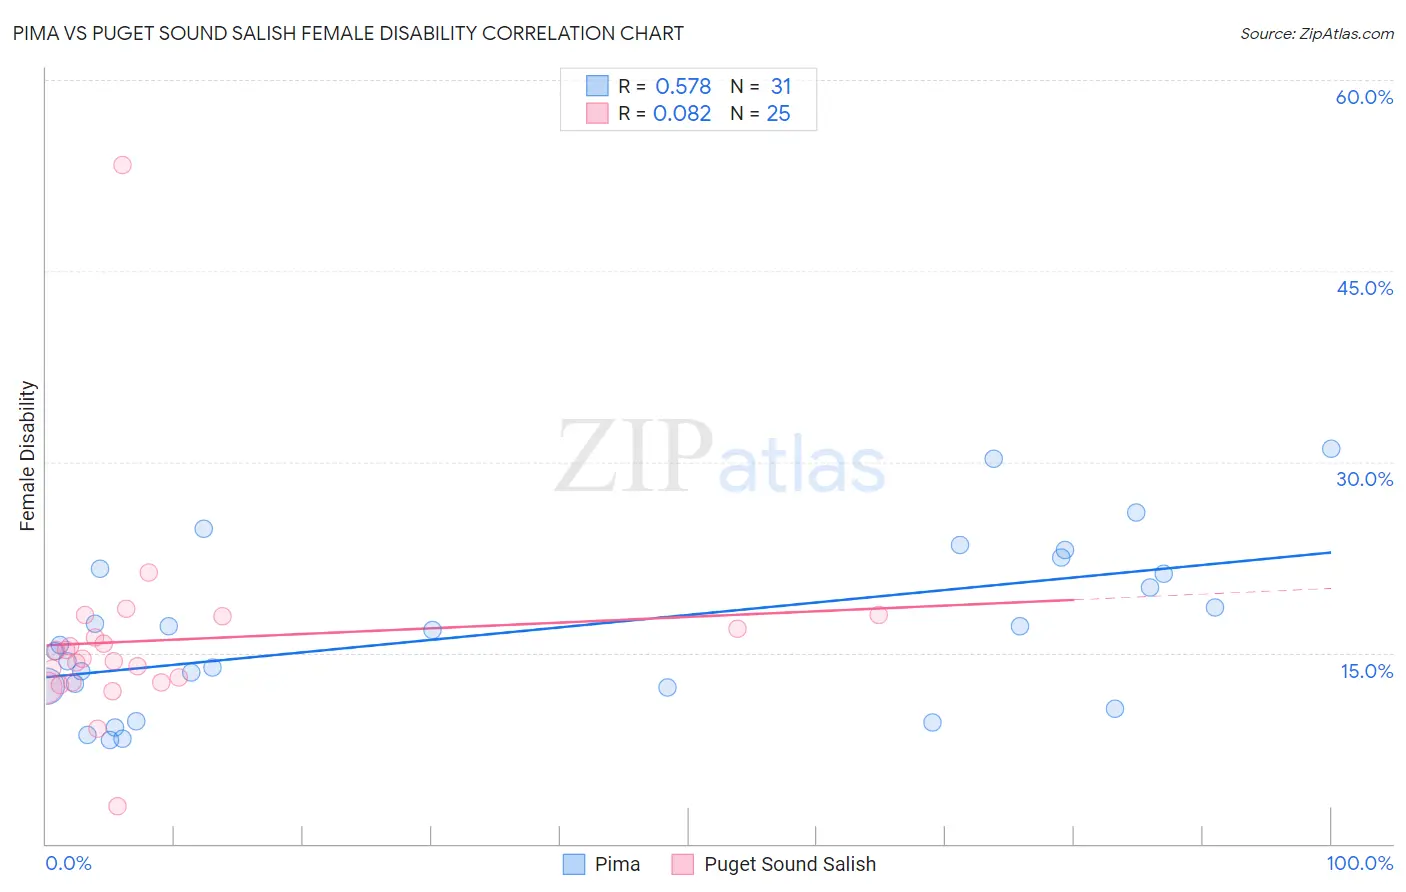
Pima vs Puget Sound Salish Female Disability Correlation Chart
The statistical analysis conducted on geographies consisting of 61,537,754 people shows a substantial positive correlation between the proportion of Pima and percentage of females with a disability in the United States with a correlation coefficient (R) of 0.578 and weighted average of 14.8%. Similarly, the statistical analysis conducted on geographies consisting of 46,152,398 people shows a slight positive correlation between the proportion of Puget Sound Salish and percentage of females with a disability in the United States with a correlation coefficient (R) of 0.082 and weighted average of 13.8%, a difference of 6.8%.
Female Disability Correlation Summary
| Measurement | Pima | Puget Sound Salish |
| Minimum | 8.1% | 2.9% |
| Maximum | 31.0% | 53.3% |
| Range | 22.9% | 50.4% |
| Mean | 16.7% | 16.0% |
| Median | 15.6% | 14.5% |
| Interquartile 25% (IQ1) | 12.3% | 12.6% |
| Interquartile 75% (IQ3) | 21.6% | 17.4% |
| Interquartile Range (IQR) | 9.3% | 4.7% |
| Standard Deviation (Sample) | 6.4% | 8.5% |
| Standard Deviation (Population) | 6.3% | 8.4% |
Demographics Similar to Pima and Puget Sound Salish by Female Disability
In terms of female disability, the demographic groups most similar to Pima are Immigrants from the Azores (14.9%, a difference of 0.39%), Immigrants from Cabo Verde (14.6%, a difference of 1.6%), Yuman (14.5%, a difference of 2.0%), Osage (14.3%, a difference of 3.4%), and Ottawa (14.2%, a difference of 3.9%). Similarly, the demographic groups most similar to Puget Sound Salish are Blackfeet (13.8%, a difference of 0.10%), Alaskan Athabascan (13.9%, a difference of 0.59%), Spanish American (14.0%, a difference of 0.95%), Chippewa (14.0%, a difference of 1.1%), and Paiute (14.0%, a difference of 1.2%).
| Demographics | Rating | Rank | Female Disability |
| Blackfeet | 0.0 /100 | #313 | Tragic 13.8% |
| Puget Sound Salish | 0.0 /100 | #314 | Tragic 13.8% |
| Alaskan Athabascans | 0.0 /100 | #315 | Tragic 13.9% |
| Spanish Americans | 0.0 /100 | #316 | Tragic 14.0% |
| Chippewa | 0.0 /100 | #317 | Tragic 14.0% |
| Paiute | 0.0 /100 | #318 | Tragic 14.0% |
| Iroquois | 0.0 /100 | #319 | Tragic 14.0% |
| Americans | 0.0 /100 | #320 | Tragic 14.1% |
| Potawatomi | 0.0 /100 | #321 | Tragic 14.1% |
| Pueblo | 0.0 /100 | #322 | Tragic 14.1% |
| Blacks/African Americans | 0.0 /100 | #323 | Tragic 14.1% |
| Natives/Alaskans | 0.0 /100 | #324 | Tragic 14.1% |
| Navajo | 0.0 /100 | #325 | Tragic 14.2% |
| Comanche | 0.0 /100 | #326 | Tragic 14.2% |
| Ottawa | 0.0 /100 | #327 | Tragic 14.2% |
| Cape Verdeans | 0.0 /100 | #328 | Tragic 14.2% |
| Osage | 0.0 /100 | #329 | Tragic 14.3% |
| Yuman | 0.0 /100 | #330 | Tragic 14.5% |
| Immigrants | Cabo Verde | 0.0 /100 | #331 | Tragic 14.6% |
| Pima | 0.0 /100 | #332 | Tragic 14.8% |
| Immigrants | Azores | 0.0 /100 | #333 | Tragic 14.9% |