Pima vs Bermudan Female Disability
COMPARE
Pima
Bermudan
Female Disability
Female Disability Comparison
Pima
Bermudans
14.8%
FEMALE DISABILITY
0.0/ 100
METRIC RATING
332nd/ 347
METRIC RANK
12.7%
FEMALE DISABILITY
1.0/ 100
METRIC RATING
261st/ 347
METRIC RANK
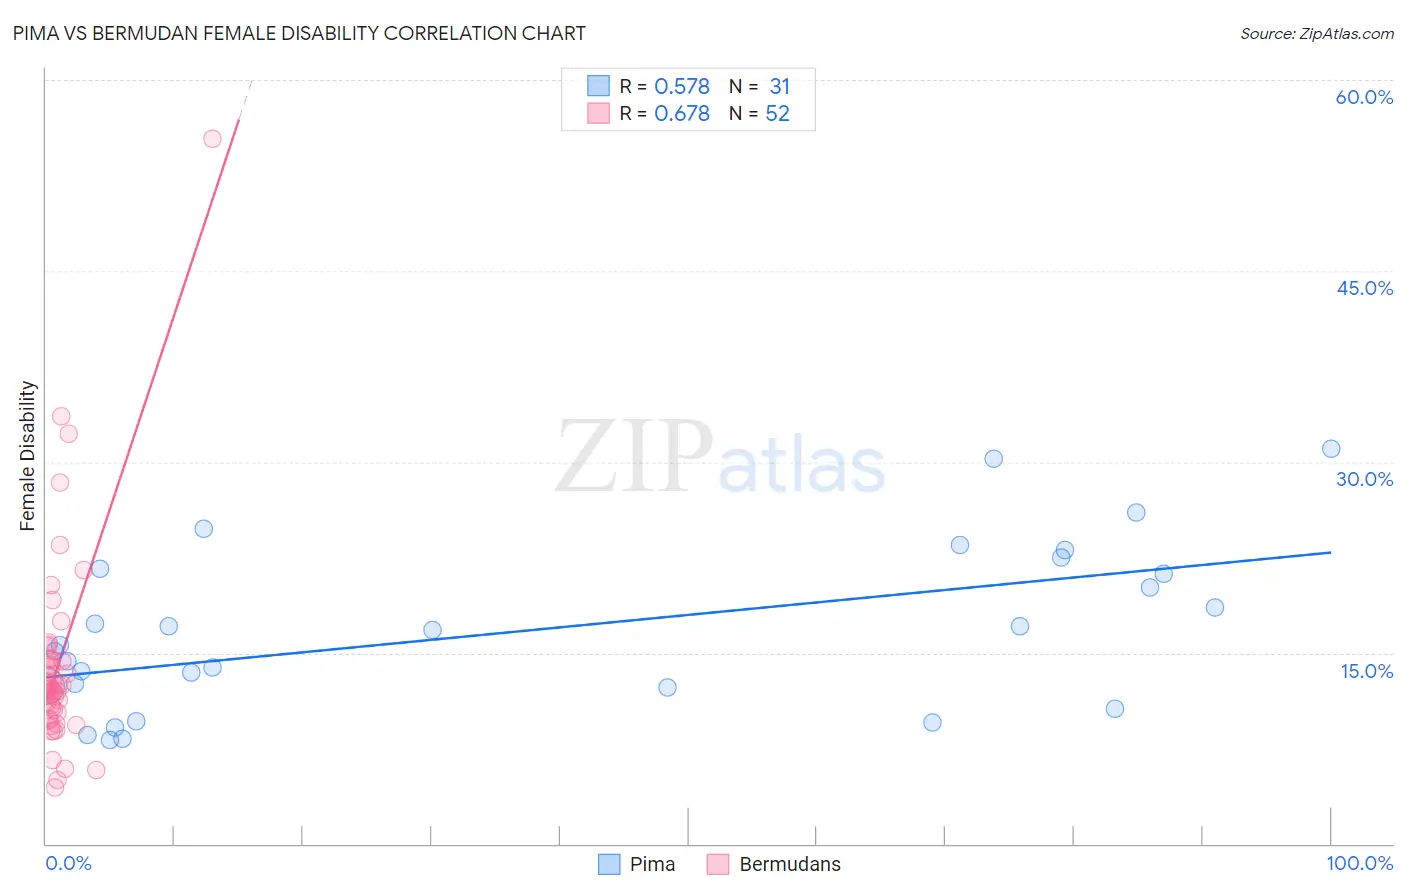
Pima vs Bermudan Female Disability Correlation Chart
The statistical analysis conducted on geographies consisting of 61,537,754 people shows a substantial positive correlation between the proportion of Pima and percentage of females with a disability in the United States with a correlation coefficient (R) of 0.578 and weighted average of 14.8%. Similarly, the statistical analysis conducted on geographies consisting of 55,721,549 people shows a significant positive correlation between the proportion of Bermudans and percentage of females with a disability in the United States with a correlation coefficient (R) of 0.678 and weighted average of 12.7%, a difference of 16.2%.
Female Disability Correlation Summary
| Measurement | Pima | Bermudan |
| Minimum | 8.1% | 4.4% |
| Maximum | 31.0% | 55.4% |
| Range | 22.9% | 51.1% |
| Mean | 16.7% | 14.1% |
| Median | 15.6% | 12.2% |
| Interquartile 25% (IQ1) | 12.3% | 10.1% |
| Interquartile 75% (IQ3) | 21.6% | 14.5% |
| Interquartile Range (IQR) | 9.3% | 4.5% |
| Standard Deviation (Sample) | 6.4% | 8.3% |
| Standard Deviation (Population) | 6.3% | 8.2% |
Similar Demographics by Female Disability
Demographics Similar to Pima by Female Disability
In terms of female disability, the demographic groups most similar to Pima are Immigrants from the Azores (14.9%, a difference of 0.39%), Cherokee (14.9%, a difference of 0.48%), Cajun (14.9%, a difference of 0.50%), Seminole (15.0%, a difference of 1.2%), and Tohono O'odham (15.0%, a difference of 1.3%).
| Demographics | Rating | Rank | Female Disability |
| Navajo | 0.0 /100 | #325 | Tragic 14.2% |
| Comanche | 0.0 /100 | #326 | Tragic 14.2% |
| Ottawa | 0.0 /100 | #327 | Tragic 14.2% |
| Cape Verdeans | 0.0 /100 | #328 | Tragic 14.2% |
| Osage | 0.0 /100 | #329 | Tragic 14.3% |
| Yuman | 0.0 /100 | #330 | Tragic 14.5% |
| Immigrants | Cabo Verde | 0.0 /100 | #331 | Tragic 14.6% |
| Pima | 0.0 /100 | #332 | Tragic 14.8% |
| Immigrants | Azores | 0.0 /100 | #333 | Tragic 14.9% |
| Cherokee | 0.0 /100 | #334 | Tragic 14.9% |
| Cajuns | 0.0 /100 | #335 | Tragic 14.9% |
| Seminole | 0.0 /100 | #336 | Tragic 15.0% |
| Tohono O'odham | 0.0 /100 | #337 | Tragic 15.0% |
| Dutch West Indians | 0.0 /100 | #338 | Tragic 15.0% |
| Colville | 0.0 /100 | #339 | Tragic 15.1% |
Demographics Similar to Bermudans by Female Disability
In terms of female disability, the demographic groups most similar to Bermudans are Subsaharan African (12.7%, a difference of 0.040%), Immigrants from Armenia (12.7%, a difference of 0.050%), Czechoslovakian (12.7%, a difference of 0.070%), Liberian (12.7%, a difference of 0.14%), and Aleut (12.7%, a difference of 0.14%).
| Demographics | Rating | Rank | Female Disability |
| Hawaiians | 1.4 /100 | #254 | Tragic 12.7% |
| Immigrants | Germany | 1.3 /100 | #255 | Tragic 12.7% |
| British West Indians | 1.2 /100 | #256 | Tragic 12.7% |
| Liberians | 1.1 /100 | #257 | Tragic 12.7% |
| Aleuts | 1.1 /100 | #258 | Tragic 12.7% |
| Immigrants | Armenia | 1.0 /100 | #259 | Tragic 12.7% |
| Sub-Saharan Africans | 1.0 /100 | #260 | Tragic 12.7% |
| Bermudans | 1.0 /100 | #261 | Tragic 12.7% |
| Czechoslovakians | 0.9 /100 | #262 | Tragic 12.7% |
| Spaniards | 0.7 /100 | #263 | Tragic 12.8% |
| Alaska Natives | 0.6 /100 | #264 | Tragic 12.8% |
| West Indians | 0.5 /100 | #265 | Tragic 12.8% |
| Finns | 0.4 /100 | #266 | Tragic 12.8% |
| Senegalese | 0.4 /100 | #267 | Tragic 12.8% |
| Immigrants | Laos | 0.4 /100 | #268 | Tragic 12.8% |