Burmese vs Puget Sound Salish Female Disability
COMPARE
Burmese
Puget Sound Salish
Female Disability
Female Disability Comparison
Burmese
Puget Sound Salish
10.7%
FEMALE DISABILITY
100.0/ 100
METRIC RATING
15th/ 347
METRIC RANK
13.8%
FEMALE DISABILITY
0.0/ 100
METRIC RATING
314th/ 347
METRIC RANK
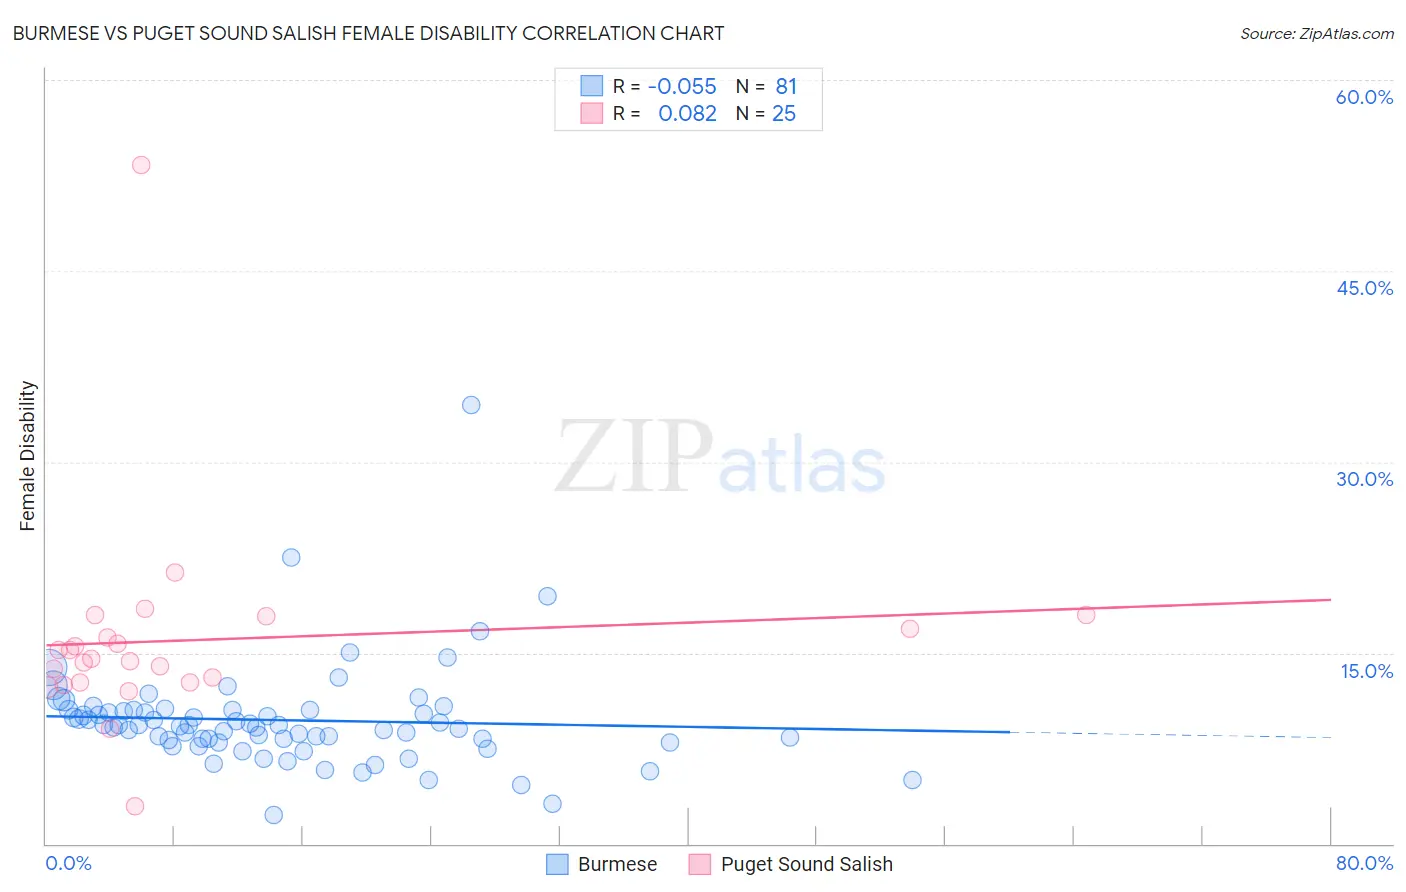
Burmese vs Puget Sound Salish Female Disability Correlation Chart
The statistical analysis conducted on geographies consisting of 465,299,673 people shows a slight negative correlation between the proportion of Burmese and percentage of females with a disability in the United States with a correlation coefficient (R) of -0.055 and weighted average of 10.7%. Similarly, the statistical analysis conducted on geographies consisting of 46,152,398 people shows a slight positive correlation between the proportion of Puget Sound Salish and percentage of females with a disability in the United States with a correlation coefficient (R) of 0.082 and weighted average of 13.8%, a difference of 28.8%.
Female Disability Correlation Summary
| Measurement | Burmese | Puget Sound Salish |
| Minimum | 2.3% | 2.9% |
| Maximum | 34.5% | 53.3% |
| Range | 32.2% | 50.4% |
| Mean | 9.7% | 16.0% |
| Median | 9.3% | 14.5% |
| Interquartile 25% (IQ1) | 8.1% | 12.6% |
| Interquartile 75% (IQ3) | 10.5% | 17.4% |
| Interquartile Range (IQR) | 2.4% | 4.7% |
| Standard Deviation (Sample) | 4.1% | 8.5% |
| Standard Deviation (Population) | 4.1% | 8.4% |
Similar Demographics by Female Disability
Demographics Similar to Burmese by Female Disability
In terms of female disability, the demographic groups most similar to Burmese are Okinawan (10.8%, a difference of 0.070%), Indian (Asian) (10.8%, a difference of 0.39%), Immigrants from China (10.7%, a difference of 0.51%), Immigrants from Eastern Asia (10.7%, a difference of 0.54%), and Immigrants from Israel (10.7%, a difference of 0.62%).
| Demographics | Rating | Rank | Female Disability |
| Immigrants | South Central Asia | 100.0 /100 | #8 | Exceptional 10.5% |
| Iranians | 100.0 /100 | #9 | Exceptional 10.6% |
| Immigrants | Hong Kong | 100.0 /100 | #10 | Exceptional 10.6% |
| Immigrants | Korea | 100.0 /100 | #11 | Exceptional 10.6% |
| Immigrants | Israel | 100.0 /100 | #12 | Exceptional 10.7% |
| Immigrants | Eastern Asia | 100.0 /100 | #13 | Exceptional 10.7% |
| Immigrants | China | 100.0 /100 | #14 | Exceptional 10.7% |
| Burmese | 100.0 /100 | #15 | Exceptional 10.7% |
| Okinawans | 100.0 /100 | #16 | Exceptional 10.8% |
| Indians (Asian) | 100.0 /100 | #17 | Exceptional 10.8% |
| Immigrants | Iran | 100.0 /100 | #18 | Exceptional 10.8% |
| Immigrants | Venezuela | 100.0 /100 | #19 | Exceptional 10.9% |
| Immigrants | Pakistan | 100.0 /100 | #20 | Exceptional 10.9% |
| Asians | 100.0 /100 | #21 | Exceptional 10.9% |
| Immigrants | Sri Lanka | 100.0 /100 | #22 | Exceptional 10.9% |
Demographics Similar to Puget Sound Salish by Female Disability
In terms of female disability, the demographic groups most similar to Puget Sound Salish are Blackfeet (13.8%, a difference of 0.10%), Delaware (13.8%, a difference of 0.42%), Alaskan Athabascan (13.9%, a difference of 0.59%), Hopi (13.7%, a difference of 0.73%), and Spanish American (14.0%, a difference of 0.95%).
| Demographics | Rating | Rank | Female Disability |
| Central American Indians | 0.0 /100 | #307 | Tragic 13.6% |
| Cree | 0.0 /100 | #308 | Tragic 13.7% |
| French American Indians | 0.0 /100 | #309 | Tragic 13.7% |
| Apache | 0.0 /100 | #310 | Tragic 13.7% |
| Hopi | 0.0 /100 | #311 | Tragic 13.7% |
| Delaware | 0.0 /100 | #312 | Tragic 13.8% |
| Blackfeet | 0.0 /100 | #313 | Tragic 13.8% |
| Puget Sound Salish | 0.0 /100 | #314 | Tragic 13.8% |
| Alaskan Athabascans | 0.0 /100 | #315 | Tragic 13.9% |
| Spanish Americans | 0.0 /100 | #316 | Tragic 14.0% |
| Chippewa | 0.0 /100 | #317 | Tragic 14.0% |
| Paiute | 0.0 /100 | #318 | Tragic 14.0% |
| Iroquois | 0.0 /100 | #319 | Tragic 14.0% |
| Americans | 0.0 /100 | #320 | Tragic 14.1% |
| Potawatomi | 0.0 /100 | #321 | Tragic 14.1% |