Haitian vs Puget Sound Salish Female Disability
COMPARE
Haitian
Puget Sound Salish
Female Disability
Female Disability Comparison
Haitians
Puget Sound Salish
12.2%
FEMALE DISABILITY
51.9/ 100
METRIC RATING
172nd/ 347
METRIC RANK
13.8%
FEMALE DISABILITY
0.0/ 100
METRIC RATING
314th/ 347
METRIC RANK
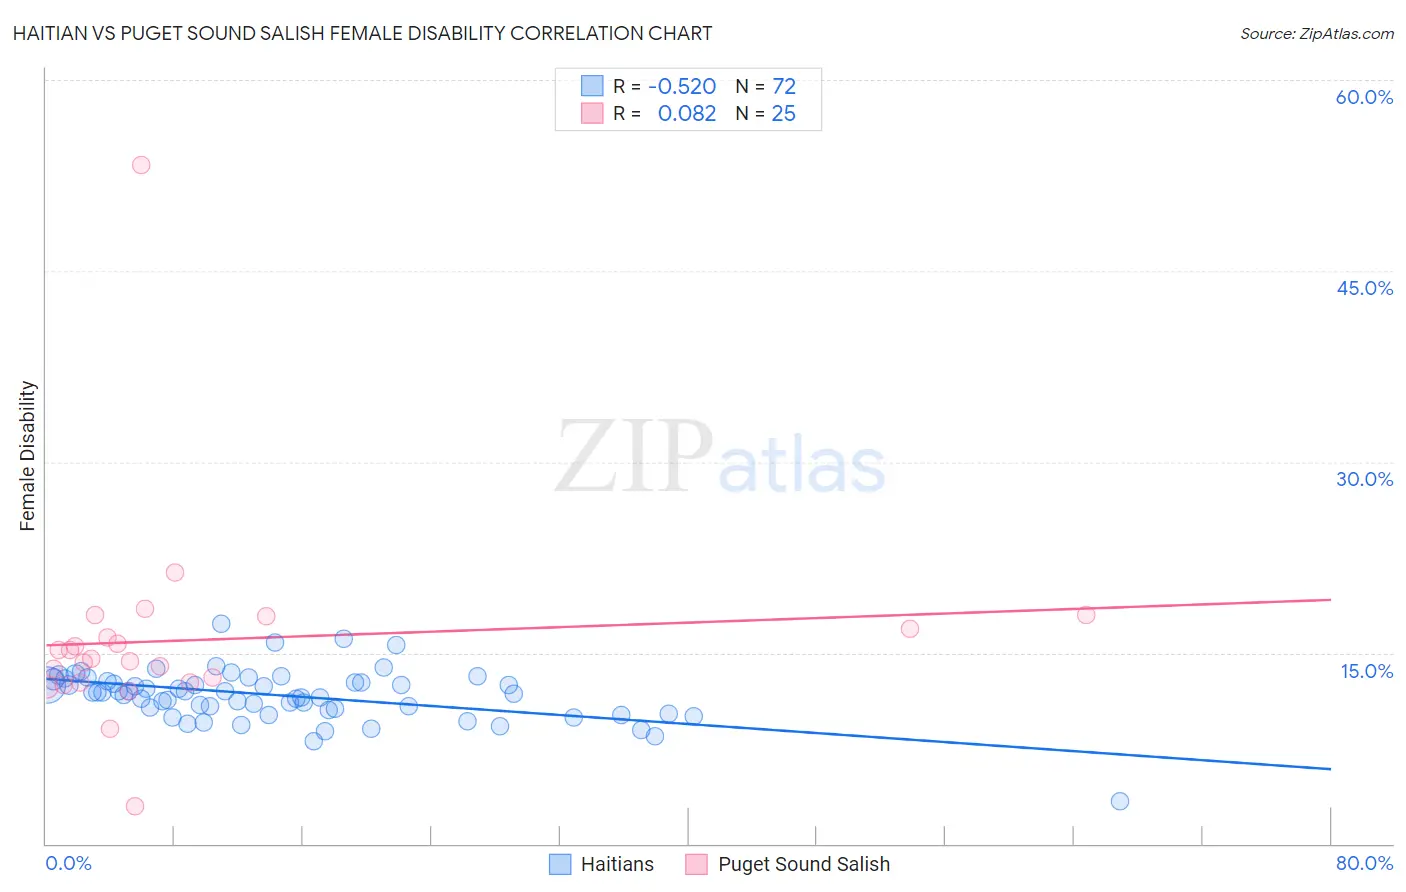
Haitian vs Puget Sound Salish Female Disability Correlation Chart
The statistical analysis conducted on geographies consisting of 287,924,181 people shows a substantial negative correlation between the proportion of Haitians and percentage of females with a disability in the United States with a correlation coefficient (R) of -0.520 and weighted average of 12.2%. Similarly, the statistical analysis conducted on geographies consisting of 46,152,398 people shows a slight positive correlation between the proportion of Puget Sound Salish and percentage of females with a disability in the United States with a correlation coefficient (R) of 0.082 and weighted average of 13.8%, a difference of 13.6%.
Female Disability Correlation Summary
| Measurement | Haitian | Puget Sound Salish |
| Minimum | 3.3% | 2.9% |
| Maximum | 17.2% | 53.3% |
| Range | 13.9% | 50.4% |
| Mean | 11.6% | 16.0% |
| Median | 11.9% | 14.5% |
| Interquartile 25% (IQ1) | 10.5% | 12.6% |
| Interquartile 75% (IQ3) | 12.7% | 17.4% |
| Interquartile Range (IQR) | 2.2% | 4.7% |
| Standard Deviation (Sample) | 2.0% | 8.5% |
| Standard Deviation (Population) | 2.0% | 8.4% |
Similar Demographics by Female Disability
Demographics Similar to Haitians by Female Disability
In terms of female disability, the demographic groups most similar to Haitians are Immigrants from Mexico (12.2%, a difference of 0.040%), Immigrants from England (12.2%, a difference of 0.070%), Immigrants from St. Vincent and the Grenadines (12.2%, a difference of 0.080%), Immigrants from Southern Europe (12.2%, a difference of 0.17%), and Maltese (12.2%, a difference of 0.19%).
| Demographics | Rating | Rank | Female Disability |
| Immigrants | Oceania | 61.8 /100 | #165 | Good 12.1% |
| Lithuanians | 59.5 /100 | #166 | Average 12.2% |
| Immigrants | Latin America | 59.0 /100 | #167 | Average 12.2% |
| Immigrants | Haiti | 58.8 /100 | #168 | Average 12.2% |
| Lebanese | 58.1 /100 | #169 | Average 12.2% |
| Maltese | 57.0 /100 | #170 | Average 12.2% |
| Immigrants | Southern Europe | 56.3 /100 | #171 | Average 12.2% |
| Haitians | 51.9 /100 | #172 | Average 12.2% |
| Immigrants | Mexico | 50.8 /100 | #173 | Average 12.2% |
| Immigrants | England | 50.0 /100 | #174 | Average 12.2% |
| Immigrants | St. Vincent and the Grenadines | 49.7 /100 | #175 | Average 12.2% |
| Immigrants | Guyana | 43.1 /100 | #176 | Average 12.2% |
| Immigrants | Ghana | 42.5 /100 | #177 | Average 12.2% |
| Immigrants | Western Europe | 40.9 /100 | #178 | Average 12.2% |
| Immigrants | Fiji | 38.2 /100 | #179 | Fair 12.3% |
Demographics Similar to Puget Sound Salish by Female Disability
In terms of female disability, the demographic groups most similar to Puget Sound Salish are Blackfeet (13.8%, a difference of 0.10%), Delaware (13.8%, a difference of 0.42%), Alaskan Athabascan (13.9%, a difference of 0.59%), Hopi (13.7%, a difference of 0.73%), and Spanish American (14.0%, a difference of 0.95%).
| Demographics | Rating | Rank | Female Disability |
| Central American Indians | 0.0 /100 | #307 | Tragic 13.6% |
| Cree | 0.0 /100 | #308 | Tragic 13.7% |
| French American Indians | 0.0 /100 | #309 | Tragic 13.7% |
| Apache | 0.0 /100 | #310 | Tragic 13.7% |
| Hopi | 0.0 /100 | #311 | Tragic 13.7% |
| Delaware | 0.0 /100 | #312 | Tragic 13.8% |
| Blackfeet | 0.0 /100 | #313 | Tragic 13.8% |
| Puget Sound Salish | 0.0 /100 | #314 | Tragic 13.8% |
| Alaskan Athabascans | 0.0 /100 | #315 | Tragic 13.9% |
| Spanish Americans | 0.0 /100 | #316 | Tragic 14.0% |
| Chippewa | 0.0 /100 | #317 | Tragic 14.0% |
| Paiute | 0.0 /100 | #318 | Tragic 14.0% |
| Iroquois | 0.0 /100 | #319 | Tragic 14.0% |
| Americans | 0.0 /100 | #320 | Tragic 14.1% |
| Potawatomi | 0.0 /100 | #321 | Tragic 14.1% |