Immigrants from Brazil vs Puget Sound Salish Female Disability
COMPARE
Immigrants from Brazil
Puget Sound Salish
Female Disability
Female Disability Comparison
Immigrants from Brazil
Puget Sound Salish
11.6%
FEMALE DISABILITY
99.4/ 100
METRIC RATING
94th/ 347
METRIC RANK
13.8%
FEMALE DISABILITY
0.0/ 100
METRIC RATING
314th/ 347
METRIC RANK
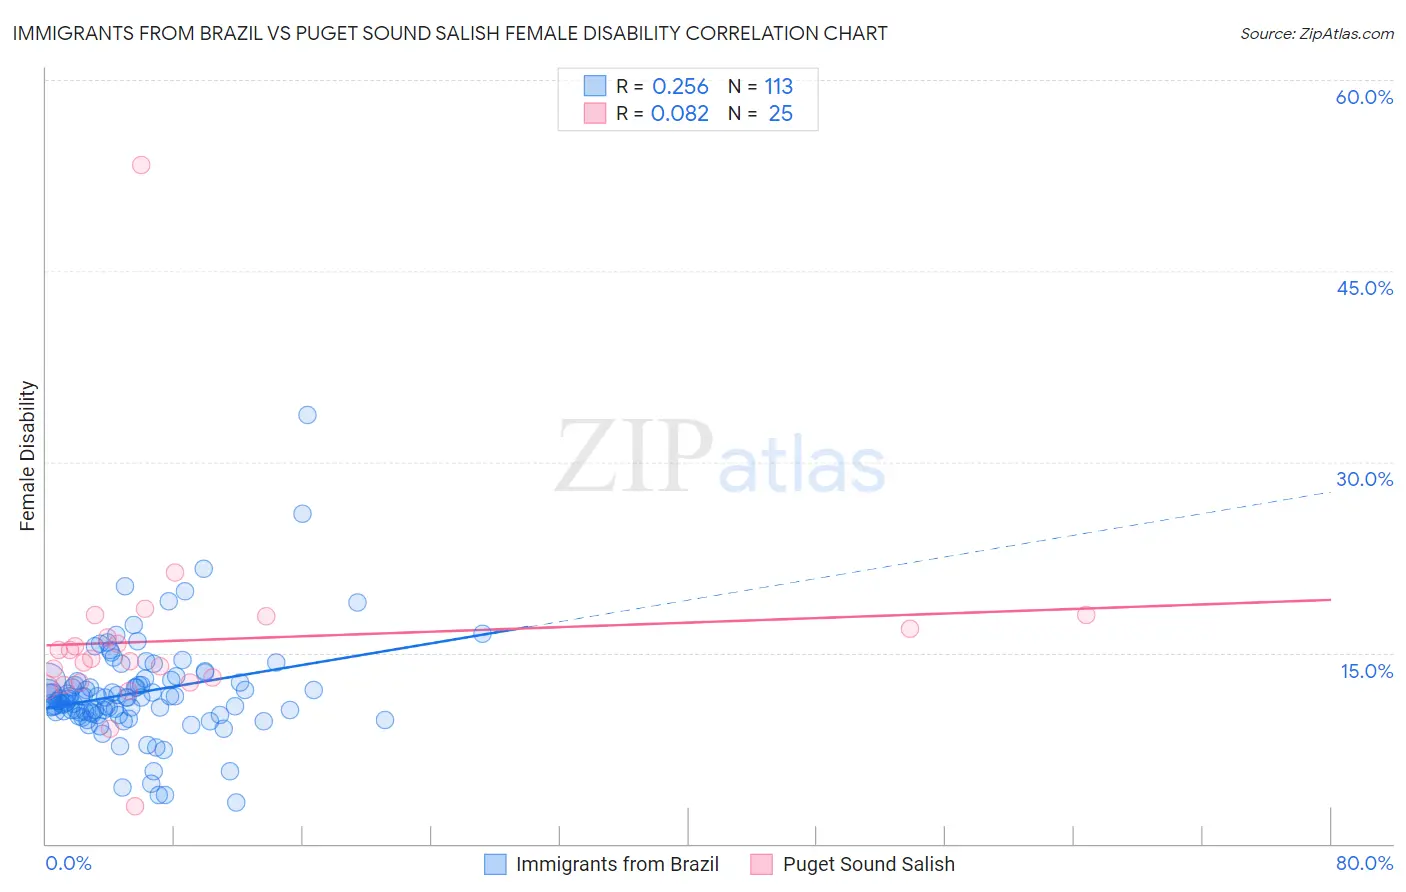
Immigrants from Brazil vs Puget Sound Salish Female Disability Correlation Chart
The statistical analysis conducted on geographies consisting of 343,005,923 people shows a weak positive correlation between the proportion of Immigrants from Brazil and percentage of females with a disability in the United States with a correlation coefficient (R) of 0.256 and weighted average of 11.6%. Similarly, the statistical analysis conducted on geographies consisting of 46,152,398 people shows a slight positive correlation between the proportion of Puget Sound Salish and percentage of females with a disability in the United States with a correlation coefficient (R) of 0.082 and weighted average of 13.8%, a difference of 19.3%.
Female Disability Correlation Summary
| Measurement | Immigrants from Brazil | Puget Sound Salish |
| Minimum | 3.2% | 2.9% |
| Maximum | 33.7% | 53.3% |
| Range | 30.5% | 50.4% |
| Mean | 11.9% | 16.0% |
| Median | 11.5% | 14.5% |
| Interquartile 25% (IQ1) | 10.3% | 12.6% |
| Interquartile 75% (IQ3) | 12.8% | 17.4% |
| Interquartile Range (IQR) | 2.5% | 4.7% |
| Standard Deviation (Sample) | 4.0% | 8.5% |
| Standard Deviation (Population) | 4.0% | 8.4% |
Similar Demographics by Female Disability
Demographics Similar to Immigrants from Brazil by Female Disability
In terms of female disability, the demographic groups most similar to Immigrants from Brazil are Immigrants from Sierra Leone (11.6%, a difference of 0.030%), Immigrants from Northern Europe (11.6%, a difference of 0.070%), Immigrants from Zimbabwe (11.6%, a difference of 0.14%), Immigrants from Czechoslovakia (11.6%, a difference of 0.14%), and Immigrants from Romania (11.6%, a difference of 0.15%).
| Demographics | Rating | Rank | Female Disability |
| Immigrants | Denmark | 99.5 /100 | #87 | Exceptional 11.6% |
| Yup'ik | 99.5 /100 | #88 | Exceptional 11.6% |
| Vietnamese | 99.5 /100 | #89 | Exceptional 11.6% |
| Immigrants | Romania | 99.5 /100 | #90 | Exceptional 11.6% |
| Immigrants | Zimbabwe | 99.5 /100 | #91 | Exceptional 11.6% |
| Immigrants | Czechoslovakia | 99.5 /100 | #92 | Exceptional 11.6% |
| Immigrants | Sierra Leone | 99.4 /100 | #93 | Exceptional 11.6% |
| Immigrants | Brazil | 99.4 /100 | #94 | Exceptional 11.6% |
| Immigrants | Northern Europe | 99.4 /100 | #95 | Exceptional 11.6% |
| Immigrants | Russia | 99.0 /100 | #96 | Exceptional 11.7% |
| Koreans | 99.0 /100 | #97 | Exceptional 11.7% |
| Uruguayans | 98.8 /100 | #98 | Exceptional 11.7% |
| Immigrants | Philippines | 98.6 /100 | #99 | Exceptional 11.7% |
| Immigrants | Uruguay | 98.5 /100 | #100 | Exceptional 11.7% |
| Immigrants | Costa Rica | 98.4 /100 | #101 | Exceptional 11.7% |
Demographics Similar to Puget Sound Salish by Female Disability
In terms of female disability, the demographic groups most similar to Puget Sound Salish are Blackfeet (13.8%, a difference of 0.10%), Delaware (13.8%, a difference of 0.42%), Alaskan Athabascan (13.9%, a difference of 0.59%), Hopi (13.7%, a difference of 0.73%), and Spanish American (14.0%, a difference of 0.95%).
| Demographics | Rating | Rank | Female Disability |
| Central American Indians | 0.0 /100 | #307 | Tragic 13.6% |
| Cree | 0.0 /100 | #308 | Tragic 13.7% |
| French American Indians | 0.0 /100 | #309 | Tragic 13.7% |
| Apache | 0.0 /100 | #310 | Tragic 13.7% |
| Hopi | 0.0 /100 | #311 | Tragic 13.7% |
| Delaware | 0.0 /100 | #312 | Tragic 13.8% |
| Blackfeet | 0.0 /100 | #313 | Tragic 13.8% |
| Puget Sound Salish | 0.0 /100 | #314 | Tragic 13.8% |
| Alaskan Athabascans | 0.0 /100 | #315 | Tragic 13.9% |
| Spanish Americans | 0.0 /100 | #316 | Tragic 14.0% |
| Chippewa | 0.0 /100 | #317 | Tragic 14.0% |
| Paiute | 0.0 /100 | #318 | Tragic 14.0% |
| Iroquois | 0.0 /100 | #319 | Tragic 14.0% |
| Americans | 0.0 /100 | #320 | Tragic 14.1% |
| Potawatomi | 0.0 /100 | #321 | Tragic 14.1% |