Tohono O'odham vs Puget Sound Salish Female Disability
COMPARE
Tohono O'odham
Puget Sound Salish
Female Disability
Female Disability Comparison
Tohono O'odham
Puget Sound Salish
15.0%
FEMALE DISABILITY
0.0/ 100
METRIC RATING
337th/ 347
METRIC RANK
13.8%
FEMALE DISABILITY
0.0/ 100
METRIC RATING
314th/ 347
METRIC RANK
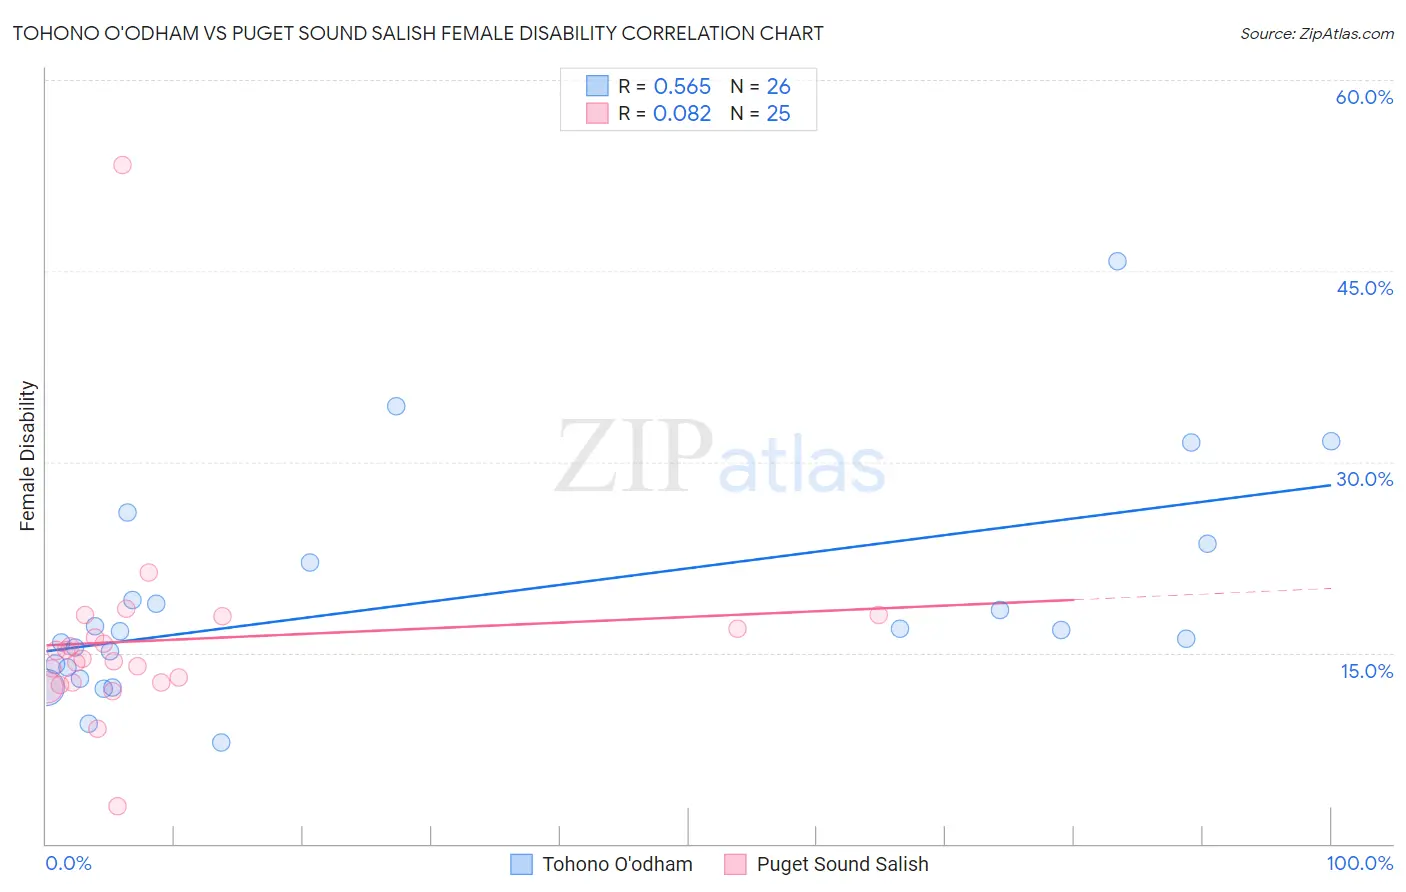
Tohono O'odham vs Puget Sound Salish Female Disability Correlation Chart
The statistical analysis conducted on geographies consisting of 58,717,428 people shows a substantial positive correlation between the proportion of Tohono O'odham and percentage of females with a disability in the United States with a correlation coefficient (R) of 0.565 and weighted average of 15.0%. Similarly, the statistical analysis conducted on geographies consisting of 46,152,398 people shows a slight positive correlation between the proportion of Puget Sound Salish and percentage of females with a disability in the United States with a correlation coefficient (R) of 0.082 and weighted average of 13.8%, a difference of 8.2%.
Female Disability Correlation Summary
| Measurement | Tohono O'odham | Puget Sound Salish |
| Minimum | 8.0% | 2.9% |
| Maximum | 45.8% | 53.3% |
| Range | 37.8% | 50.4% |
| Mean | 19.1% | 16.0% |
| Median | 16.7% | 14.5% |
| Interquartile 25% (IQ1) | 13.9% | 12.6% |
| Interquartile 75% (IQ3) | 22.1% | 17.4% |
| Interquartile Range (IQR) | 8.3% | 4.7% |
| Standard Deviation (Sample) | 8.6% | 8.5% |
| Standard Deviation (Population) | 8.4% | 8.4% |
Similar Demographics by Female Disability
Demographics Similar to Tohono O'odham by Female Disability
In terms of female disability, the demographic groups most similar to Tohono O'odham are Seminole (15.0%, a difference of 0.12%), Dutch West Indian (15.0%, a difference of 0.14%), Colville (15.1%, a difference of 0.55%), Cajun (14.9%, a difference of 0.80%), and Cherokee (14.9%, a difference of 0.82%).
| Demographics | Rating | Rank | Female Disability |
| Yuman | 0.0 /100 | #330 | Tragic 14.5% |
| Immigrants | Cabo Verde | 0.0 /100 | #331 | Tragic 14.6% |
| Pima | 0.0 /100 | #332 | Tragic 14.8% |
| Immigrants | Azores | 0.0 /100 | #333 | Tragic 14.9% |
| Cherokee | 0.0 /100 | #334 | Tragic 14.9% |
| Cajuns | 0.0 /100 | #335 | Tragic 14.9% |
| Seminole | 0.0 /100 | #336 | Tragic 15.0% |
| Tohono O'odham | 0.0 /100 | #337 | Tragic 15.0% |
| Dutch West Indians | 0.0 /100 | #338 | Tragic 15.0% |
| Colville | 0.0 /100 | #339 | Tragic 15.1% |
| Chickasaw | 0.0 /100 | #340 | Tragic 15.2% |
| Choctaw | 0.0 /100 | #341 | Tragic 15.4% |
| Creek | 0.0 /100 | #342 | Tragic 15.7% |
| Lumbee | 0.0 /100 | #343 | Tragic 15.8% |
| Kiowa | 0.0 /100 | #344 | Tragic 15.8% |
Demographics Similar to Puget Sound Salish by Female Disability
In terms of female disability, the demographic groups most similar to Puget Sound Salish are Blackfeet (13.8%, a difference of 0.10%), Delaware (13.8%, a difference of 0.42%), Alaskan Athabascan (13.9%, a difference of 0.59%), Hopi (13.7%, a difference of 0.73%), and Spanish American (14.0%, a difference of 0.95%).
| Demographics | Rating | Rank | Female Disability |
| Central American Indians | 0.0 /100 | #307 | Tragic 13.6% |
| Cree | 0.0 /100 | #308 | Tragic 13.7% |
| French American Indians | 0.0 /100 | #309 | Tragic 13.7% |
| Apache | 0.0 /100 | #310 | Tragic 13.7% |
| Hopi | 0.0 /100 | #311 | Tragic 13.7% |
| Delaware | 0.0 /100 | #312 | Tragic 13.8% |
| Blackfeet | 0.0 /100 | #313 | Tragic 13.8% |
| Puget Sound Salish | 0.0 /100 | #314 | Tragic 13.8% |
| Alaskan Athabascans | 0.0 /100 | #315 | Tragic 13.9% |
| Spanish Americans | 0.0 /100 | #316 | Tragic 14.0% |
| Chippewa | 0.0 /100 | #317 | Tragic 14.0% |
| Paiute | 0.0 /100 | #318 | Tragic 14.0% |
| Iroquois | 0.0 /100 | #319 | Tragic 14.0% |
| Americans | 0.0 /100 | #320 | Tragic 14.1% |
| Potawatomi | 0.0 /100 | #321 | Tragic 14.1% |