Bermudan vs Puget Sound Salish Female Disability
COMPARE
Bermudan
Puget Sound Salish
Female Disability
Female Disability Comparison
Bermudans
Puget Sound Salish
12.7%
FEMALE DISABILITY
1.0/ 100
METRIC RATING
261st/ 347
METRIC RANK
13.8%
FEMALE DISABILITY
0.0/ 100
METRIC RATING
314th/ 347
METRIC RANK
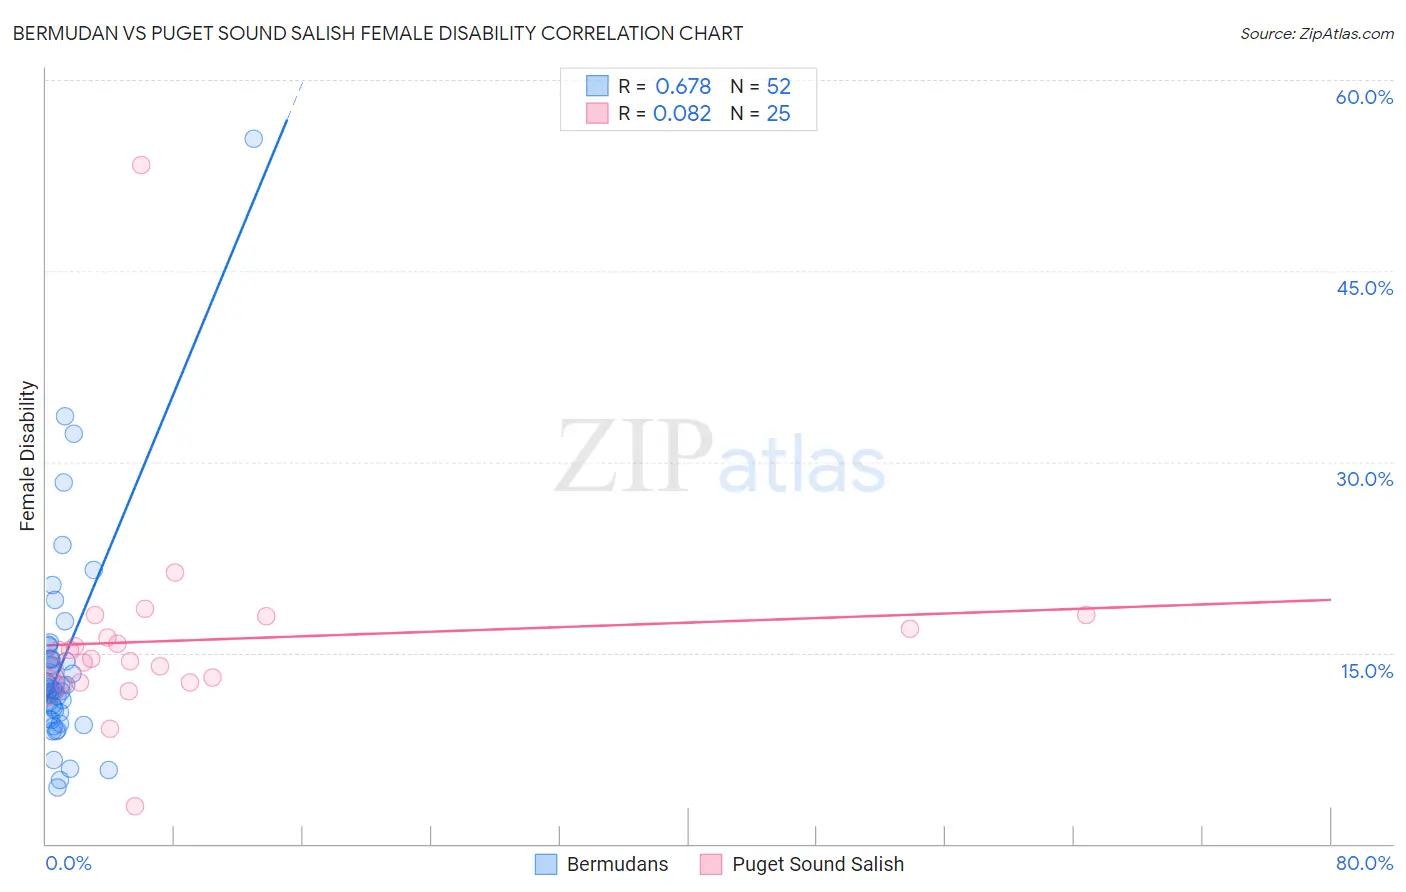
Bermudan vs Puget Sound Salish Female Disability Correlation Chart
The statistical analysis conducted on geographies consisting of 55,721,549 people shows a significant positive correlation between the proportion of Bermudans and percentage of females with a disability in the United States with a correlation coefficient (R) of 0.678 and weighted average of 12.7%. Similarly, the statistical analysis conducted on geographies consisting of 46,152,398 people shows a slight positive correlation between the proportion of Puget Sound Salish and percentage of females with a disability in the United States with a correlation coefficient (R) of 0.082 and weighted average of 13.8%, a difference of 8.8%.
Female Disability Correlation Summary
| Measurement | Bermudan | Puget Sound Salish |
| Minimum | 4.4% | 2.9% |
| Maximum | 55.4% | 53.3% |
| Range | 51.1% | 50.4% |
| Mean | 14.1% | 16.0% |
| Median | 12.2% | 14.5% |
| Interquartile 25% (IQ1) | 10.1% | 12.6% |
| Interquartile 75% (IQ3) | 14.5% | 17.4% |
| Interquartile Range (IQR) | 4.5% | 4.7% |
| Standard Deviation (Sample) | 8.3% | 8.5% |
| Standard Deviation (Population) | 8.2% | 8.4% |
Similar Demographics by Female Disability
Demographics Similar to Bermudans by Female Disability
In terms of female disability, the demographic groups most similar to Bermudans are Subsaharan African (12.7%, a difference of 0.040%), Immigrants from Armenia (12.7%, a difference of 0.050%), Czechoslovakian (12.7%, a difference of 0.070%), Liberian (12.7%, a difference of 0.14%), and Aleut (12.7%, a difference of 0.14%).
| Demographics | Rating | Rank | Female Disability |
| Hawaiians | 1.4 /100 | #254 | Tragic 12.7% |
| Immigrants | Germany | 1.3 /100 | #255 | Tragic 12.7% |
| British West Indians | 1.2 /100 | #256 | Tragic 12.7% |
| Liberians | 1.1 /100 | #257 | Tragic 12.7% |
| Aleuts | 1.1 /100 | #258 | Tragic 12.7% |
| Immigrants | Armenia | 1.0 /100 | #259 | Tragic 12.7% |
| Sub-Saharan Africans | 1.0 /100 | #260 | Tragic 12.7% |
| Bermudans | 1.0 /100 | #261 | Tragic 12.7% |
| Czechoslovakians | 0.9 /100 | #262 | Tragic 12.7% |
| Spaniards | 0.7 /100 | #263 | Tragic 12.8% |
| Alaska Natives | 0.6 /100 | #264 | Tragic 12.8% |
| West Indians | 0.5 /100 | #265 | Tragic 12.8% |
| Finns | 0.4 /100 | #266 | Tragic 12.8% |
| Senegalese | 0.4 /100 | #267 | Tragic 12.8% |
| Immigrants | Laos | 0.4 /100 | #268 | Tragic 12.8% |
Demographics Similar to Puget Sound Salish by Female Disability
In terms of female disability, the demographic groups most similar to Puget Sound Salish are Blackfeet (13.8%, a difference of 0.10%), Delaware (13.8%, a difference of 0.42%), Alaskan Athabascan (13.9%, a difference of 0.59%), Hopi (13.7%, a difference of 0.73%), and Spanish American (14.0%, a difference of 0.95%).
| Demographics | Rating | Rank | Female Disability |
| Central American Indians | 0.0 /100 | #307 | Tragic 13.6% |
| Cree | 0.0 /100 | #308 | Tragic 13.7% |
| French American Indians | 0.0 /100 | #309 | Tragic 13.7% |
| Apache | 0.0 /100 | #310 | Tragic 13.7% |
| Hopi | 0.0 /100 | #311 | Tragic 13.7% |
| Delaware | 0.0 /100 | #312 | Tragic 13.8% |
| Blackfeet | 0.0 /100 | #313 | Tragic 13.8% |
| Puget Sound Salish | 0.0 /100 | #314 | Tragic 13.8% |
| Alaskan Athabascans | 0.0 /100 | #315 | Tragic 13.9% |
| Spanish Americans | 0.0 /100 | #316 | Tragic 14.0% |
| Chippewa | 0.0 /100 | #317 | Tragic 14.0% |
| Paiute | 0.0 /100 | #318 | Tragic 14.0% |
| Iroquois | 0.0 /100 | #319 | Tragic 14.0% |
| Americans | 0.0 /100 | #320 | Tragic 14.1% |
| Potawatomi | 0.0 /100 | #321 | Tragic 14.1% |