Pima vs Immigrants from Guyana Female Disability
COMPARE
Pima
Immigrants from Guyana
Female Disability
Female Disability Comparison
Pima
Immigrants from Guyana
14.8%
FEMALE DISABILITY
0.0/ 100
METRIC RATING
332nd/ 347
METRIC RANK
12.2%
FEMALE DISABILITY
43.1/ 100
METRIC RATING
176th/ 347
METRIC RANK
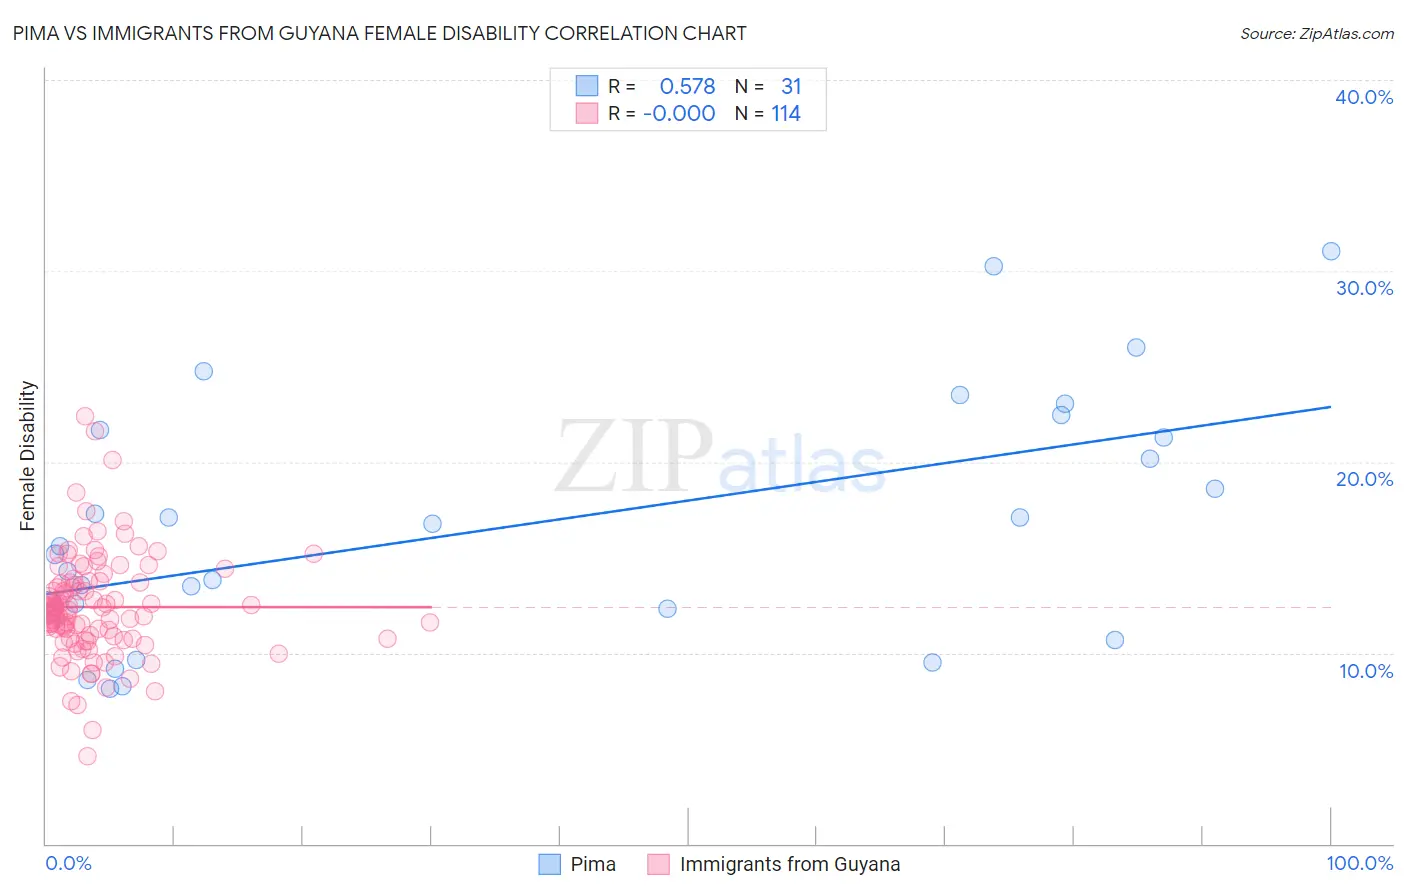
Pima vs Immigrants from Guyana Female Disability Correlation Chart
The statistical analysis conducted on geographies consisting of 61,537,754 people shows a substantial positive correlation between the proportion of Pima and percentage of females with a disability in the United States with a correlation coefficient (R) of 0.578 and weighted average of 14.8%. Similarly, the statistical analysis conducted on geographies consisting of 183,713,039 people shows no correlation between the proportion of Immigrants from Guyana and percentage of females with a disability in the United States with a correlation coefficient (R) of -0.000 and weighted average of 12.2%, a difference of 21.0%.
Female Disability Correlation Summary
| Measurement | Pima | Immigrants from Guyana |
| Minimum | 8.1% | 4.6% |
| Maximum | 31.0% | 22.4% |
| Range | 22.9% | 17.8% |
| Mean | 16.7% | 12.4% |
| Median | 15.6% | 12.2% |
| Interquartile 25% (IQ1) | 12.3% | 10.8% |
| Interquartile 75% (IQ3) | 21.6% | 13.7% |
| Interquartile Range (IQR) | 9.3% | 2.9% |
| Standard Deviation (Sample) | 6.4% | 2.7% |
| Standard Deviation (Population) | 6.3% | 2.7% |
Similar Demographics by Female Disability
Demographics Similar to Pima by Female Disability
In terms of female disability, the demographic groups most similar to Pima are Immigrants from the Azores (14.9%, a difference of 0.39%), Cherokee (14.9%, a difference of 0.48%), Cajun (14.9%, a difference of 0.50%), Seminole (15.0%, a difference of 1.2%), and Tohono O'odham (15.0%, a difference of 1.3%).
| Demographics | Rating | Rank | Female Disability |
| Navajo | 0.0 /100 | #325 | Tragic 14.2% |
| Comanche | 0.0 /100 | #326 | Tragic 14.2% |
| Ottawa | 0.0 /100 | #327 | Tragic 14.2% |
| Cape Verdeans | 0.0 /100 | #328 | Tragic 14.2% |
| Osage | 0.0 /100 | #329 | Tragic 14.3% |
| Yuman | 0.0 /100 | #330 | Tragic 14.5% |
| Immigrants | Cabo Verde | 0.0 /100 | #331 | Tragic 14.6% |
| Pima | 0.0 /100 | #332 | Tragic 14.8% |
| Immigrants | Azores | 0.0 /100 | #333 | Tragic 14.9% |
| Cherokee | 0.0 /100 | #334 | Tragic 14.9% |
| Cajuns | 0.0 /100 | #335 | Tragic 14.9% |
| Seminole | 0.0 /100 | #336 | Tragic 15.0% |
| Tohono O'odham | 0.0 /100 | #337 | Tragic 15.0% |
| Dutch West Indians | 0.0 /100 | #338 | Tragic 15.0% |
| Colville | 0.0 /100 | #339 | Tragic 15.1% |
Demographics Similar to Immigrants from Guyana by Female Disability
In terms of female disability, the demographic groups most similar to Immigrants from Guyana are Immigrants from Ghana (12.2%, a difference of 0.030%), Immigrants from Western Europe (12.2%, a difference of 0.080%), Immigrants from Fiji (12.3%, a difference of 0.19%), Albanian (12.3%, a difference of 0.20%), and Immigrants from Canada (12.3%, a difference of 0.23%).
| Demographics | Rating | Rank | Female Disability |
| Lebanese | 58.1 /100 | #169 | Average 12.2% |
| Maltese | 57.0 /100 | #170 | Average 12.2% |
| Immigrants | Southern Europe | 56.3 /100 | #171 | Average 12.2% |
| Haitians | 51.9 /100 | #172 | Average 12.2% |
| Immigrants | Mexico | 50.8 /100 | #173 | Average 12.2% |
| Immigrants | England | 50.0 /100 | #174 | Average 12.2% |
| Immigrants | St. Vincent and the Grenadines | 49.7 /100 | #175 | Average 12.2% |
| Immigrants | Guyana | 43.1 /100 | #176 | Average 12.2% |
| Immigrants | Ghana | 42.5 /100 | #177 | Average 12.2% |
| Immigrants | Western Europe | 40.9 /100 | #178 | Average 12.2% |
| Immigrants | Fiji | 38.2 /100 | #179 | Fair 12.3% |
| Albanians | 37.9 /100 | #180 | Fair 12.3% |
| Immigrants | Canada | 37.2 /100 | #181 | Fair 12.3% |
| Norwegians | 36.9 /100 | #182 | Fair 12.3% |
| Cubans | 36.5 /100 | #183 | Fair 12.3% |