Pima vs Scandinavian Female Disability
COMPARE
Pima
Scandinavian
Female Disability
Female Disability Comparison
Pima
Scandinavians
14.8%
FEMALE DISABILITY
0.0/ 100
METRIC RATING
332nd/ 347
METRIC RANK
12.5%
FEMALE DISABILITY
5.3/ 100
METRIC RATING
234th/ 347
METRIC RANK
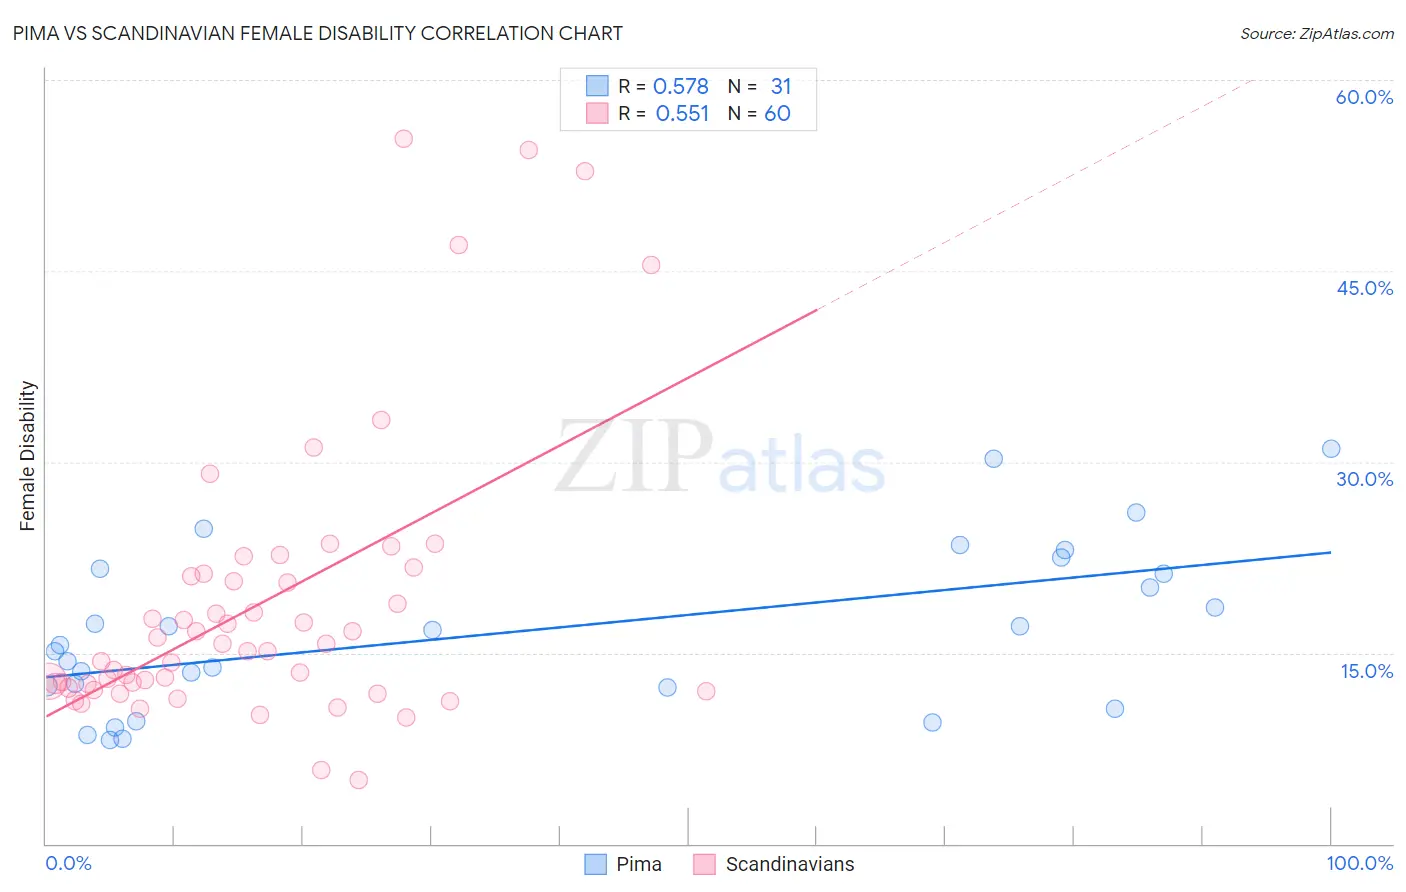
Pima vs Scandinavian Female Disability Correlation Chart
The statistical analysis conducted on geographies consisting of 61,537,754 people shows a substantial positive correlation between the proportion of Pima and percentage of females with a disability in the United States with a correlation coefficient (R) of 0.578 and weighted average of 14.8%. Similarly, the statistical analysis conducted on geographies consisting of 472,506,229 people shows a substantial positive correlation between the proportion of Scandinavians and percentage of females with a disability in the United States with a correlation coefficient (R) of 0.551 and weighted average of 12.5%, a difference of 18.1%.
Female Disability Correlation Summary
| Measurement | Pima | Scandinavian |
| Minimum | 8.1% | 5.0% |
| Maximum | 31.0% | 55.4% |
| Range | 22.9% | 50.4% |
| Mean | 16.7% | 18.9% |
| Median | 15.6% | 15.4% |
| Interquartile 25% (IQ1) | 12.3% | 12.4% |
| Interquartile 75% (IQ3) | 21.6% | 21.1% |
| Interquartile Range (IQR) | 9.3% | 8.7% |
| Standard Deviation (Sample) | 6.4% | 11.3% |
| Standard Deviation (Population) | 6.3% | 11.2% |
Similar Demographics by Female Disability
Demographics Similar to Pima by Female Disability
In terms of female disability, the demographic groups most similar to Pima are Immigrants from the Azores (14.9%, a difference of 0.39%), Cherokee (14.9%, a difference of 0.48%), Cajun (14.9%, a difference of 0.50%), Seminole (15.0%, a difference of 1.2%), and Tohono O'odham (15.0%, a difference of 1.3%).
| Demographics | Rating | Rank | Female Disability |
| Navajo | 0.0 /100 | #325 | Tragic 14.2% |
| Comanche | 0.0 /100 | #326 | Tragic 14.2% |
| Ottawa | 0.0 /100 | #327 | Tragic 14.2% |
| Cape Verdeans | 0.0 /100 | #328 | Tragic 14.2% |
| Osage | 0.0 /100 | #329 | Tragic 14.3% |
| Yuman | 0.0 /100 | #330 | Tragic 14.5% |
| Immigrants | Cabo Verde | 0.0 /100 | #331 | Tragic 14.6% |
| Pima | 0.0 /100 | #332 | Tragic 14.8% |
| Immigrants | Azores | 0.0 /100 | #333 | Tragic 14.9% |
| Cherokee | 0.0 /100 | #334 | Tragic 14.9% |
| Cajuns | 0.0 /100 | #335 | Tragic 14.9% |
| Seminole | 0.0 /100 | #336 | Tragic 15.0% |
| Tohono O'odham | 0.0 /100 | #337 | Tragic 15.0% |
| Dutch West Indians | 0.0 /100 | #338 | Tragic 15.0% |
| Colville | 0.0 /100 | #339 | Tragic 15.1% |
Demographics Similar to Scandinavians by Female Disability
In terms of female disability, the demographic groups most similar to Scandinavians are Immigrants from Iraq (12.5%, a difference of 0.010%), Malaysian (12.5%, a difference of 0.050%), Immigrants from Somalia (12.5%, a difference of 0.11%), Immigrants from West Indies (12.6%, a difference of 0.18%), and Belgian (12.5%, a difference of 0.20%).
| Demographics | Rating | Rank | Female Disability |
| Assyrians/Chaldeans/Syriacs | 8.0 /100 | #227 | Tragic 12.5% |
| Immigrants | Cambodia | 7.8 /100 | #228 | Tragic 12.5% |
| Hungarians | 7.2 /100 | #229 | Tragic 12.5% |
| Immigrants | Belize | 7.0 /100 | #230 | Tragic 12.5% |
| Belgians | 6.5 /100 | #231 | Tragic 12.5% |
| Immigrants | Somalia | 5.9 /100 | #232 | Tragic 12.5% |
| Immigrants | Iraq | 5.3 /100 | #233 | Tragic 12.5% |
| Scandinavians | 5.3 /100 | #234 | Tragic 12.5% |
| Malaysians | 5.0 /100 | #235 | Tragic 12.5% |
| Immigrants | West Indies | 4.4 /100 | #236 | Tragic 12.6% |
| Slavs | 3.8 /100 | #237 | Tragic 12.6% |
| Yugoslavians | 3.7 /100 | #238 | Tragic 12.6% |
| Barbadians | 3.6 /100 | #239 | Tragic 12.6% |
| German Russians | 3.2 /100 | #240 | Tragic 12.6% |
| Japanese | 2.7 /100 | #241 | Tragic 12.6% |