Pima vs Immigrants from Switzerland Female Disability
COMPARE
Pima
Immigrants from Switzerland
Female Disability
Female Disability Comparison
Pima
Immigrants from Switzerland
14.8%
FEMALE DISABILITY
0.0/ 100
METRIC RATING
332nd/ 347
METRIC RANK
11.5%
FEMALE DISABILITY
99.8/ 100
METRIC RATING
73rd/ 347
METRIC RANK
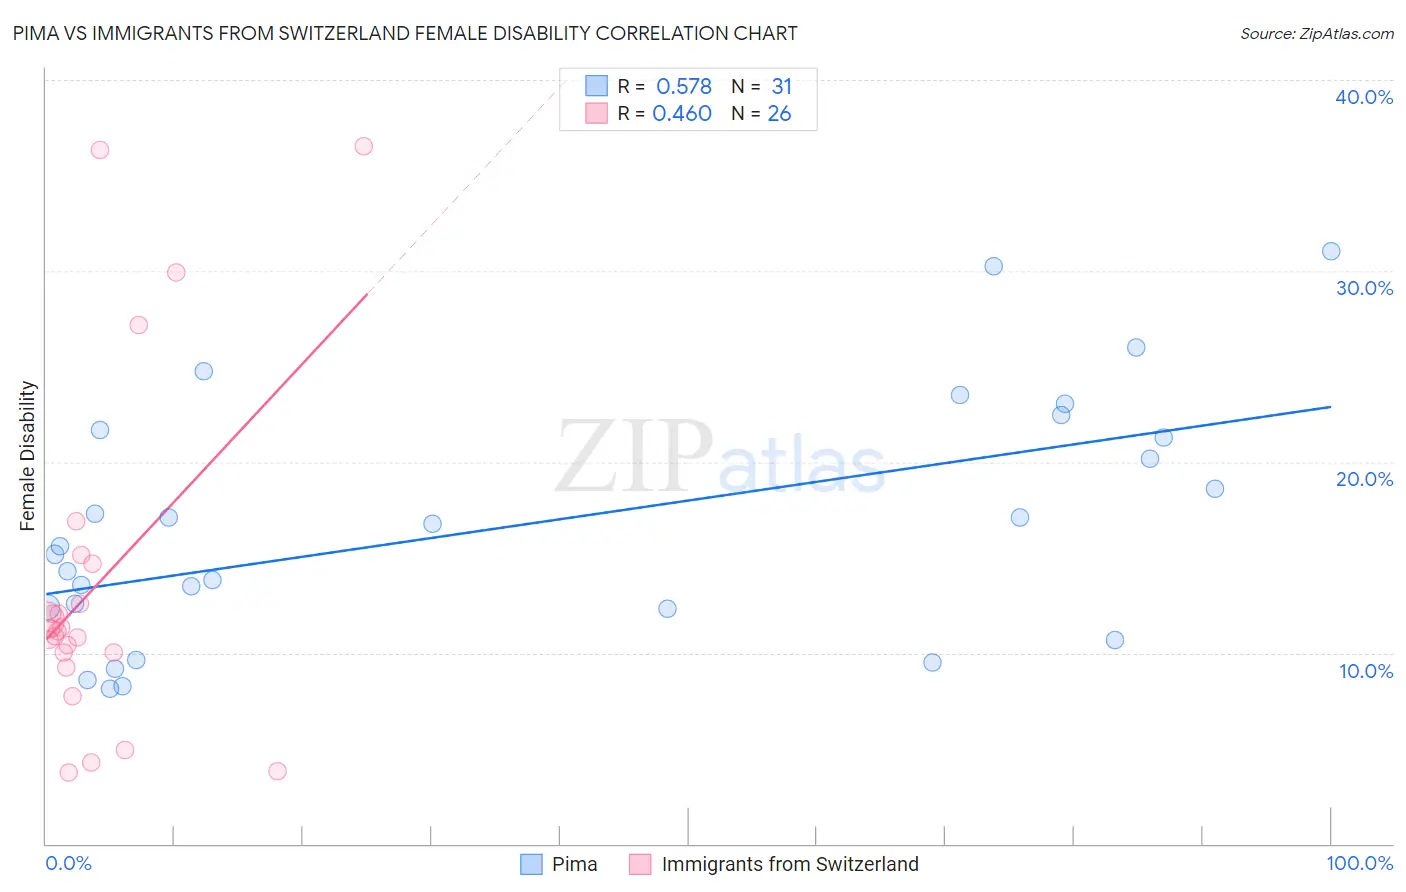
Pima vs Immigrants from Switzerland Female Disability Correlation Chart
The statistical analysis conducted on geographies consisting of 61,537,754 people shows a substantial positive correlation between the proportion of Pima and percentage of females with a disability in the United States with a correlation coefficient (R) of 0.578 and weighted average of 14.8%. Similarly, the statistical analysis conducted on geographies consisting of 148,080,197 people shows a moderate positive correlation between the proportion of Immigrants from Switzerland and percentage of females with a disability in the United States with a correlation coefficient (R) of 0.460 and weighted average of 11.5%, a difference of 28.7%.
Female Disability Correlation Summary
| Measurement | Pima | Immigrants from Switzerland |
| Minimum | 8.1% | 3.7% |
| Maximum | 31.0% | 36.5% |
| Range | 22.9% | 32.8% |
| Mean | 16.7% | 13.7% |
| Median | 15.6% | 11.2% |
| Interquartile 25% (IQ1) | 12.3% | 10.0% |
| Interquartile 75% (IQ3) | 21.6% | 14.6% |
| Interquartile Range (IQR) | 9.3% | 4.6% |
| Standard Deviation (Sample) | 6.4% | 8.9% |
| Standard Deviation (Population) | 6.3% | 8.8% |
Similar Demographics by Female Disability
Demographics Similar to Pima by Female Disability
In terms of female disability, the demographic groups most similar to Pima are Immigrants from the Azores (14.9%, a difference of 0.39%), Cherokee (14.9%, a difference of 0.48%), Cajun (14.9%, a difference of 0.50%), Seminole (15.0%, a difference of 1.2%), and Tohono O'odham (15.0%, a difference of 1.3%).
| Demographics | Rating | Rank | Female Disability |
| Navajo | 0.0 /100 | #325 | Tragic 14.2% |
| Comanche | 0.0 /100 | #326 | Tragic 14.2% |
| Ottawa | 0.0 /100 | #327 | Tragic 14.2% |
| Cape Verdeans | 0.0 /100 | #328 | Tragic 14.2% |
| Osage | 0.0 /100 | #329 | Tragic 14.3% |
| Yuman | 0.0 /100 | #330 | Tragic 14.5% |
| Immigrants | Cabo Verde | 0.0 /100 | #331 | Tragic 14.6% |
| Pima | 0.0 /100 | #332 | Tragic 14.8% |
| Immigrants | Azores | 0.0 /100 | #333 | Tragic 14.9% |
| Cherokee | 0.0 /100 | #334 | Tragic 14.9% |
| Cajuns | 0.0 /100 | #335 | Tragic 14.9% |
| Seminole | 0.0 /100 | #336 | Tragic 15.0% |
| Tohono O'odham | 0.0 /100 | #337 | Tragic 15.0% |
| Dutch West Indians | 0.0 /100 | #338 | Tragic 15.0% |
| Colville | 0.0 /100 | #339 | Tragic 15.1% |
Demographics Similar to Immigrants from Switzerland by Female Disability
In terms of female disability, the demographic groups most similar to Immigrants from Switzerland are Chilean (11.5%, a difference of 0.020%), Immigrants from Ireland (11.5%, a difference of 0.080%), Bhutanese (11.5%, a difference of 0.080%), Immigrants from Chile (11.5%, a difference of 0.13%), and Colombian (11.5%, a difference of 0.14%).
| Demographics | Rating | Rank | Female Disability |
| Salvadorans | 99.8 /100 | #66 | Exceptional 11.5% |
| Immigrants | Vietnam | 99.8 /100 | #67 | Exceptional 11.5% |
| Immigrants | Northern Africa | 99.8 /100 | #68 | Exceptional 11.5% |
| Colombians | 99.8 /100 | #69 | Exceptional 11.5% |
| Immigrants | Chile | 99.8 /100 | #70 | Exceptional 11.5% |
| Immigrants | Ireland | 99.8 /100 | #71 | Exceptional 11.5% |
| Chileans | 99.8 /100 | #72 | Exceptional 11.5% |
| Immigrants | Switzerland | 99.8 /100 | #73 | Exceptional 11.5% |
| Bhutanese | 99.8 /100 | #74 | Exceptional 11.5% |
| Immigrants | Lebanon | 99.7 /100 | #75 | Exceptional 11.5% |
| Immigrants | Eritrea | 99.7 /100 | #76 | Exceptional 11.5% |
| Immigrants | Afghanistan | 99.7 /100 | #77 | Exceptional 11.5% |
| Immigrants | South Africa | 99.7 /100 | #78 | Exceptional 11.5% |
| Sierra Leoneans | 99.7 /100 | #79 | Exceptional 11.5% |
| Immigrants | Jordan | 99.7 /100 | #80 | Exceptional 11.5% |