Guamanian/Chamorro vs Puget Sound Salish Female Disability
COMPARE
Guamanian/Chamorro
Puget Sound Salish
Female Disability
Female Disability Comparison
Guamanians/Chamorros
Puget Sound Salish
12.5%
FEMALE DISABILITY
9.5/ 100
METRIC RATING
223rd/ 347
METRIC RANK
13.8%
FEMALE DISABILITY
0.0/ 100
METRIC RATING
314th/ 347
METRIC RANK
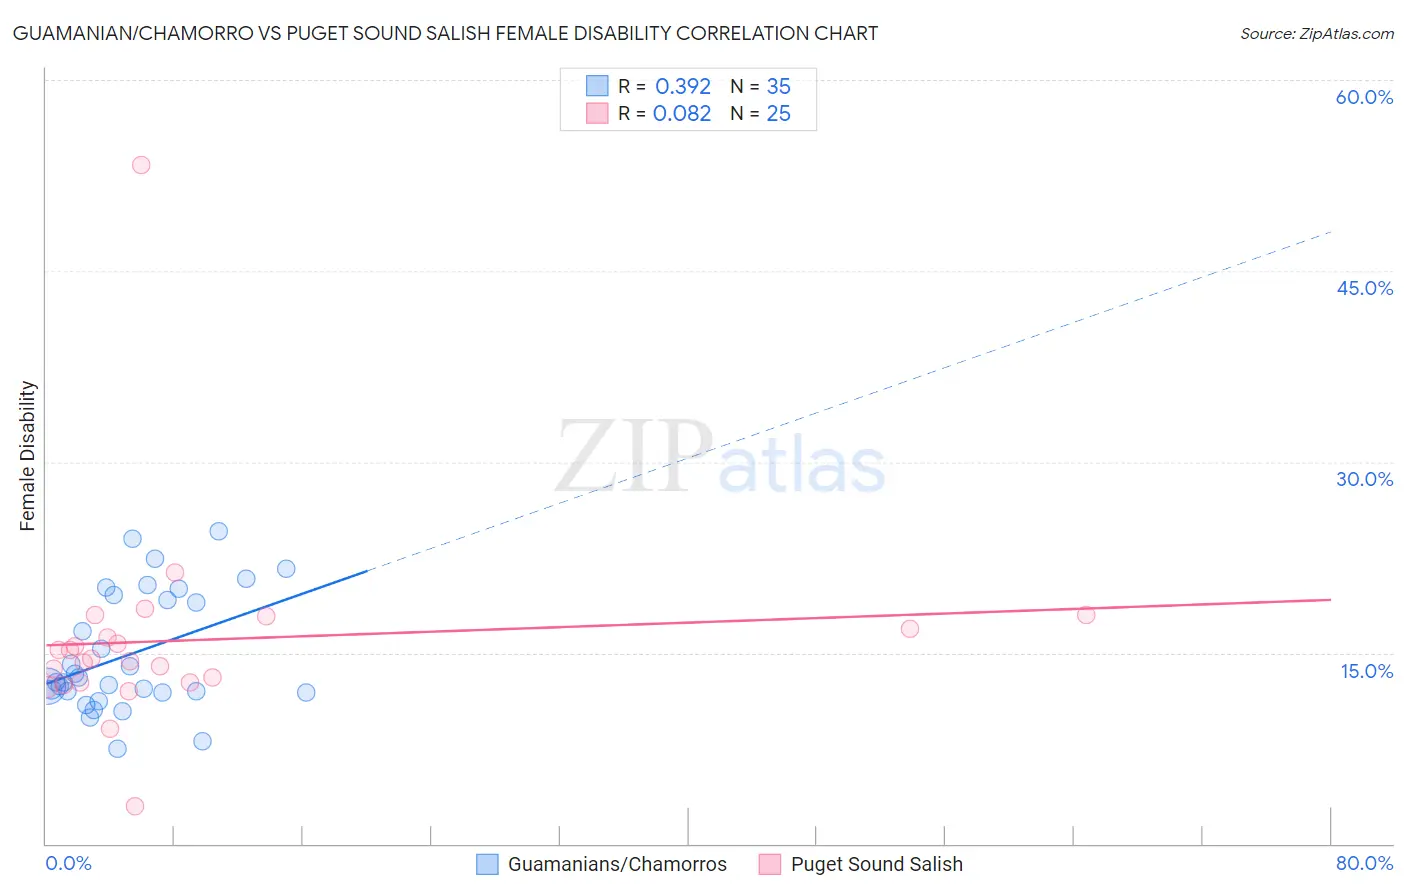
Guamanian/Chamorro vs Puget Sound Salish Female Disability Correlation Chart
The statistical analysis conducted on geographies consisting of 221,879,045 people shows a mild positive correlation between the proportion of Guamanians/Chamorros and percentage of females with a disability in the United States with a correlation coefficient (R) of 0.392 and weighted average of 12.5%. Similarly, the statistical analysis conducted on geographies consisting of 46,152,398 people shows a slight positive correlation between the proportion of Puget Sound Salish and percentage of females with a disability in the United States with a correlation coefficient (R) of 0.082 and weighted average of 13.8%, a difference of 11.2%.
Female Disability Correlation Summary
| Measurement | Guamanian/Chamorro | Puget Sound Salish |
| Minimum | 7.5% | 2.9% |
| Maximum | 24.6% | 53.3% |
| Range | 17.1% | 50.4% |
| Mean | 14.9% | 16.0% |
| Median | 12.7% | 14.5% |
| Interquartile 25% (IQ1) | 11.9% | 12.6% |
| Interquartile 75% (IQ3) | 19.5% | 17.4% |
| Interquartile Range (IQR) | 7.6% | 4.7% |
| Standard Deviation (Sample) | 4.7% | 8.5% |
| Standard Deviation (Population) | 4.6% | 8.4% |
Similar Demographics by Female Disability
Demographics Similar to Guamanians/Chamorros by Female Disability
In terms of female disability, the demographic groups most similar to Guamanians/Chamorros are Belizean (12.5%, a difference of 0.020%), Polish (12.5%, a difference of 0.12%), Italian (12.4%, a difference of 0.13%), Native Hawaiian (12.4%, a difference of 0.14%), and Bahamian (12.4%, a difference of 0.16%).
| Demographics | Rating | Rank | Female Disability |
| Immigrants | Burma/Myanmar | 13.3 /100 | #216 | Poor 12.4% |
| British | 12.7 /100 | #217 | Poor 12.4% |
| Immigrants | Bahamas | 12.5 /100 | #218 | Poor 12.4% |
| Europeans | 12.1 /100 | #219 | Poor 12.4% |
| Bahamians | 11.1 /100 | #220 | Poor 12.4% |
| Native Hawaiians | 10.8 /100 | #221 | Poor 12.4% |
| Italians | 10.7 /100 | #222 | Poor 12.4% |
| Guamanians/Chamorros | 9.5 /100 | #223 | Tragic 12.5% |
| Belizeans | 9.3 /100 | #224 | Tragic 12.5% |
| Poles | 8.4 /100 | #225 | Tragic 12.5% |
| Hispanics or Latinos | 8.0 /100 | #226 | Tragic 12.5% |
| Assyrians/Chaldeans/Syriacs | 8.0 /100 | #227 | Tragic 12.5% |
| Immigrants | Cambodia | 7.8 /100 | #228 | Tragic 12.5% |
| Hungarians | 7.2 /100 | #229 | Tragic 12.5% |
| Immigrants | Belize | 7.0 /100 | #230 | Tragic 12.5% |
Demographics Similar to Puget Sound Salish by Female Disability
In terms of female disability, the demographic groups most similar to Puget Sound Salish are Blackfeet (13.8%, a difference of 0.10%), Delaware (13.8%, a difference of 0.42%), Alaskan Athabascan (13.9%, a difference of 0.59%), Hopi (13.7%, a difference of 0.73%), and Spanish American (14.0%, a difference of 0.95%).
| Demographics | Rating | Rank | Female Disability |
| Central American Indians | 0.0 /100 | #307 | Tragic 13.6% |
| Cree | 0.0 /100 | #308 | Tragic 13.7% |
| French American Indians | 0.0 /100 | #309 | Tragic 13.7% |
| Apache | 0.0 /100 | #310 | Tragic 13.7% |
| Hopi | 0.0 /100 | #311 | Tragic 13.7% |
| Delaware | 0.0 /100 | #312 | Tragic 13.8% |
| Blackfeet | 0.0 /100 | #313 | Tragic 13.8% |
| Puget Sound Salish | 0.0 /100 | #314 | Tragic 13.8% |
| Alaskan Athabascans | 0.0 /100 | #315 | Tragic 13.9% |
| Spanish Americans | 0.0 /100 | #316 | Tragic 14.0% |
| Chippewa | 0.0 /100 | #317 | Tragic 14.0% |
| Paiute | 0.0 /100 | #318 | Tragic 14.0% |
| Iroquois | 0.0 /100 | #319 | Tragic 14.0% |
| Americans | 0.0 /100 | #320 | Tragic 14.1% |
| Potawatomi | 0.0 /100 | #321 | Tragic 14.1% |