Pima vs Immigrants from Jordan Female Disability
COMPARE
Pima
Immigrants from Jordan
Female Disability
Female Disability Comparison
Pima
Immigrants from Jordan
14.8%
FEMALE DISABILITY
0.0/ 100
METRIC RATING
332nd/ 347
METRIC RANK
11.5%
FEMALE DISABILITY
99.7/ 100
METRIC RATING
80th/ 347
METRIC RANK
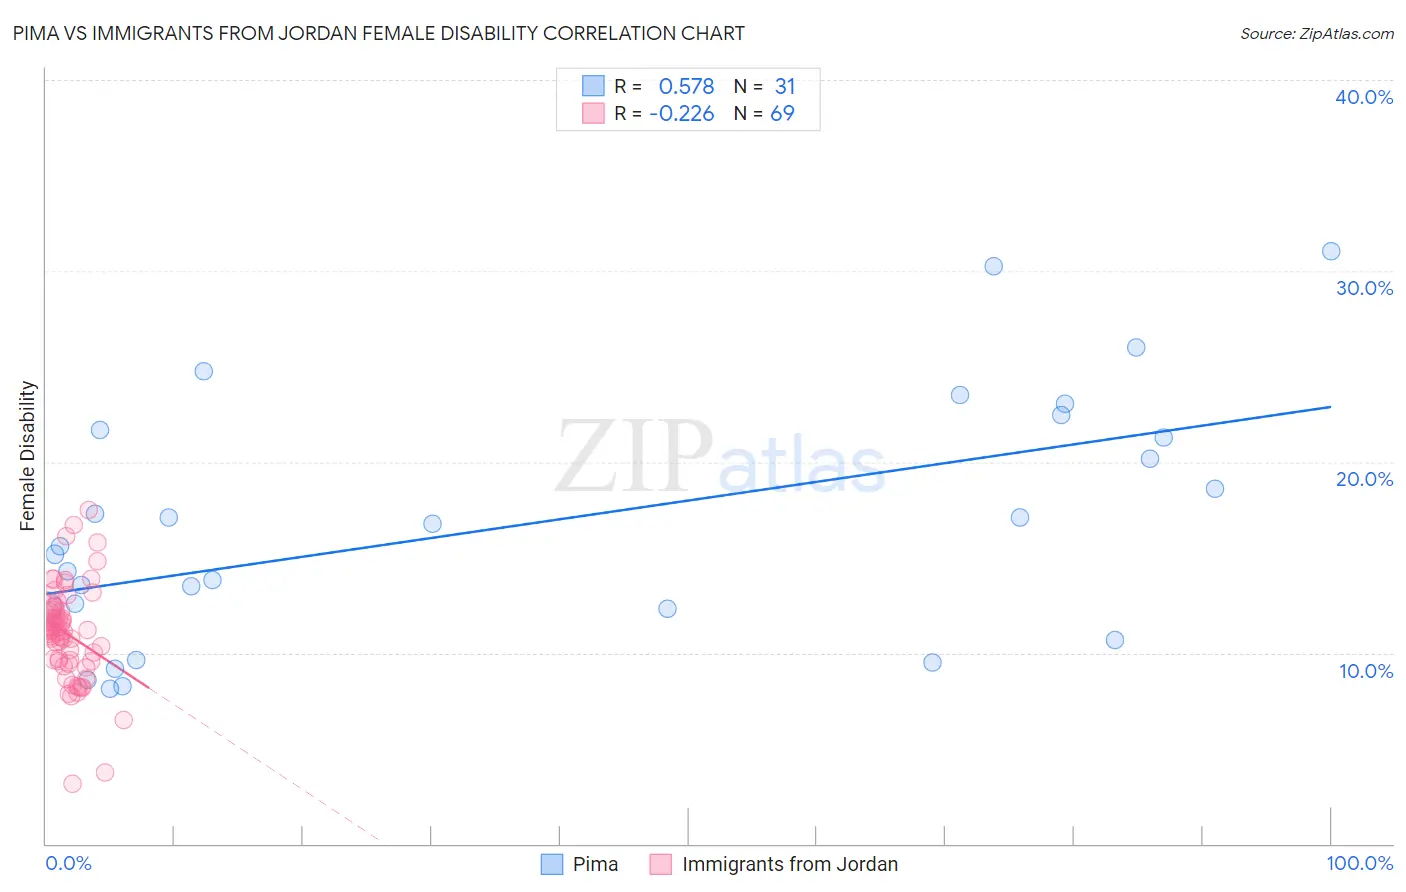
Pima vs Immigrants from Jordan Female Disability Correlation Chart
The statistical analysis conducted on geographies consisting of 61,537,754 people shows a substantial positive correlation between the proportion of Pima and percentage of females with a disability in the United States with a correlation coefficient (R) of 0.578 and weighted average of 14.8%. Similarly, the statistical analysis conducted on geographies consisting of 181,274,102 people shows a weak negative correlation between the proportion of Immigrants from Jordan and percentage of females with a disability in the United States with a correlation coefficient (R) of -0.226 and weighted average of 11.5%, a difference of 28.4%.
Female Disability Correlation Summary
| Measurement | Pima | Immigrants from Jordan |
| Minimum | 8.1% | 3.2% |
| Maximum | 31.0% | 17.5% |
| Range | 22.9% | 14.3% |
| Mean | 16.7% | 11.0% |
| Median | 15.6% | 11.1% |
| Interquartile 25% (IQ1) | 12.3% | 9.6% |
| Interquartile 75% (IQ3) | 21.6% | 12.2% |
| Interquartile Range (IQR) | 9.3% | 2.6% |
| Standard Deviation (Sample) | 6.4% | 2.6% |
| Standard Deviation (Population) | 6.3% | 2.5% |
Similar Demographics by Female Disability
Demographics Similar to Pima by Female Disability
In terms of female disability, the demographic groups most similar to Pima are Immigrants from the Azores (14.9%, a difference of 0.39%), Cherokee (14.9%, a difference of 0.48%), Cajun (14.9%, a difference of 0.50%), Seminole (15.0%, a difference of 1.2%), and Tohono O'odham (15.0%, a difference of 1.3%).
| Demographics | Rating | Rank | Female Disability |
| Navajo | 0.0 /100 | #325 | Tragic 14.2% |
| Comanche | 0.0 /100 | #326 | Tragic 14.2% |
| Ottawa | 0.0 /100 | #327 | Tragic 14.2% |
| Cape Verdeans | 0.0 /100 | #328 | Tragic 14.2% |
| Osage | 0.0 /100 | #329 | Tragic 14.3% |
| Yuman | 0.0 /100 | #330 | Tragic 14.5% |
| Immigrants | Cabo Verde | 0.0 /100 | #331 | Tragic 14.6% |
| Pima | 0.0 /100 | #332 | Tragic 14.8% |
| Immigrants | Azores | 0.0 /100 | #333 | Tragic 14.9% |
| Cherokee | 0.0 /100 | #334 | Tragic 14.9% |
| Cajuns | 0.0 /100 | #335 | Tragic 14.9% |
| Seminole | 0.0 /100 | #336 | Tragic 15.0% |
| Tohono O'odham | 0.0 /100 | #337 | Tragic 15.0% |
| Dutch West Indians | 0.0 /100 | #338 | Tragic 15.0% |
| Colville | 0.0 /100 | #339 | Tragic 15.1% |
Demographics Similar to Immigrants from Jordan by Female Disability
In terms of female disability, the demographic groups most similar to Immigrants from Jordan are Sierra Leonean (11.5%, a difference of 0.010%), Immigrants from South Africa (11.5%, a difference of 0.030%), Immigrants from Eritrea (11.5%, a difference of 0.040%), Immigrants from Afghanistan (11.5%, a difference of 0.040%), and Immigrants from Lebanon (11.5%, a difference of 0.080%).
| Demographics | Rating | Rank | Female Disability |
| Immigrants | Switzerland | 99.8 /100 | #73 | Exceptional 11.5% |
| Bhutanese | 99.8 /100 | #74 | Exceptional 11.5% |
| Immigrants | Lebanon | 99.7 /100 | #75 | Exceptional 11.5% |
| Immigrants | Eritrea | 99.7 /100 | #76 | Exceptional 11.5% |
| Immigrants | Afghanistan | 99.7 /100 | #77 | Exceptional 11.5% |
| Immigrants | South Africa | 99.7 /100 | #78 | Exceptional 11.5% |
| Sierra Leoneans | 99.7 /100 | #79 | Exceptional 11.5% |
| Immigrants | Jordan | 99.7 /100 | #80 | Exceptional 11.5% |
| Eastern Europeans | 99.7 /100 | #81 | Exceptional 11.5% |
| Luxembourgers | 99.6 /100 | #82 | Exceptional 11.6% |
| Immigrants | Serbia | 99.6 /100 | #83 | Exceptional 11.6% |
| Immigrants | Poland | 99.6 /100 | #84 | Exceptional 11.6% |
| Palestinians | 99.6 /100 | #85 | Exceptional 11.6% |
| Immigrants | Cameroon | 99.6 /100 | #86 | Exceptional 11.6% |
| Immigrants | Denmark | 99.5 /100 | #87 | Exceptional 11.6% |