Mexican American Indian vs Immigrants from Jordan Female Disability
COMPARE
Mexican American Indian
Immigrants from Jordan
Female Disability
Female Disability Comparison
Mexican American Indians
Immigrants from Jordan
12.3%
FEMALE DISABILITY
24.9/ 100
METRIC RATING
198th/ 347
METRIC RANK
11.5%
FEMALE DISABILITY
99.7/ 100
METRIC RATING
80th/ 347
METRIC RANK
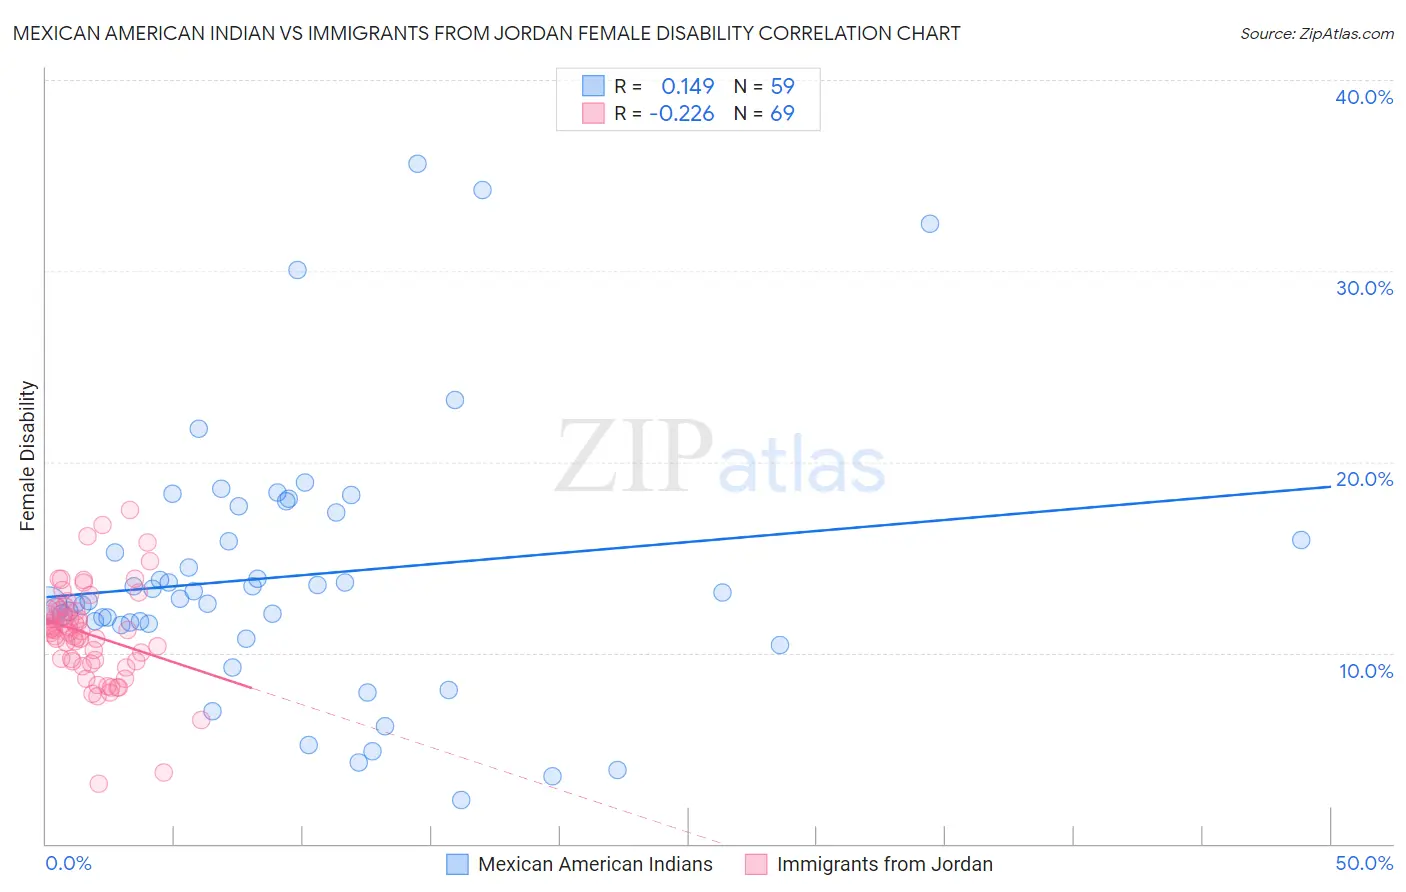
Mexican American Indian vs Immigrants from Jordan Female Disability Correlation Chart
The statistical analysis conducted on geographies consisting of 317,566,879 people shows a poor positive correlation between the proportion of Mexican American Indians and percentage of females with a disability in the United States with a correlation coefficient (R) of 0.149 and weighted average of 12.3%. Similarly, the statistical analysis conducted on geographies consisting of 181,274,102 people shows a weak negative correlation between the proportion of Immigrants from Jordan and percentage of females with a disability in the United States with a correlation coefficient (R) of -0.226 and weighted average of 11.5%, a difference of 6.9%.
Female Disability Correlation Summary
| Measurement | Mexican American Indian | Immigrants from Jordan |
| Minimum | 2.3% | 3.2% |
| Maximum | 35.6% | 17.5% |
| Range | 33.3% | 14.3% |
| Mean | 14.0% | 11.0% |
| Median | 12.8% | 11.1% |
| Interquartile 25% (IQ1) | 11.5% | 9.6% |
| Interquartile 75% (IQ3) | 17.3% | 12.2% |
| Interquartile Range (IQR) | 5.8% | 2.6% |
| Standard Deviation (Sample) | 6.8% | 2.6% |
| Standard Deviation (Population) | 6.8% | 2.5% |
Similar Demographics by Female Disability
Demographics Similar to Mexican American Indians by Female Disability
In terms of female disability, the demographic groups most similar to Mexican American Indians are Immigrants from Trinidad and Tobago (12.3%, a difference of 0.010%), Immigrants from Panama (12.3%, a difference of 0.030%), Honduran (12.3%, a difference of 0.030%), Swedish (12.3%, a difference of 0.080%), and Ukrainian (12.3%, a difference of 0.11%).
| Demographics | Rating | Rank | Female Disability |
| Armenians | 29.7 /100 | #191 | Fair 12.3% |
| Immigrants | Western Africa | 29.2 /100 | #192 | Fair 12.3% |
| Northern Europeans | 27.5 /100 | #193 | Fair 12.3% |
| Ukrainians | 27.2 /100 | #194 | Fair 12.3% |
| Swedes | 26.6 /100 | #195 | Fair 12.3% |
| Immigrants | Panama | 25.5 /100 | #196 | Fair 12.3% |
| Hondurans | 25.4 /100 | #197 | Fair 12.3% |
| Mexican American Indians | 24.9 /100 | #198 | Fair 12.3% |
| Immigrants | Trinidad and Tobago | 24.7 /100 | #199 | Fair 12.3% |
| Trinidadians and Tobagonians | 22.4 /100 | #200 | Fair 12.3% |
| Chinese | 22.1 /100 | #201 | Fair 12.3% |
| Somalis | 21.5 /100 | #202 | Fair 12.3% |
| Immigrants | Barbados | 21.1 /100 | #203 | Fair 12.3% |
| Immigrants | Zaire | 20.9 /100 | #204 | Fair 12.3% |
| Immigrants | Grenada | 20.5 /100 | #205 | Fair 12.4% |
Demographics Similar to Immigrants from Jordan by Female Disability
In terms of female disability, the demographic groups most similar to Immigrants from Jordan are Sierra Leonean (11.5%, a difference of 0.010%), Immigrants from South Africa (11.5%, a difference of 0.030%), Immigrants from Eritrea (11.5%, a difference of 0.040%), Immigrants from Afghanistan (11.5%, a difference of 0.040%), and Immigrants from Lebanon (11.5%, a difference of 0.080%).
| Demographics | Rating | Rank | Female Disability |
| Immigrants | Switzerland | 99.8 /100 | #73 | Exceptional 11.5% |
| Bhutanese | 99.8 /100 | #74 | Exceptional 11.5% |
| Immigrants | Lebanon | 99.7 /100 | #75 | Exceptional 11.5% |
| Immigrants | Eritrea | 99.7 /100 | #76 | Exceptional 11.5% |
| Immigrants | Afghanistan | 99.7 /100 | #77 | Exceptional 11.5% |
| Immigrants | South Africa | 99.7 /100 | #78 | Exceptional 11.5% |
| Sierra Leoneans | 99.7 /100 | #79 | Exceptional 11.5% |
| Immigrants | Jordan | 99.7 /100 | #80 | Exceptional 11.5% |
| Eastern Europeans | 99.7 /100 | #81 | Exceptional 11.5% |
| Luxembourgers | 99.6 /100 | #82 | Exceptional 11.6% |
| Immigrants | Serbia | 99.6 /100 | #83 | Exceptional 11.6% |
| Immigrants | Poland | 99.6 /100 | #84 | Exceptional 11.6% |
| Palestinians | 99.6 /100 | #85 | Exceptional 11.6% |
| Immigrants | Cameroon | 99.6 /100 | #86 | Exceptional 11.6% |
| Immigrants | Denmark | 99.5 /100 | #87 | Exceptional 11.6% |