Barbadian vs Immigrants from Jordan Female Disability
COMPARE
Barbadian
Immigrants from Jordan
Female Disability
Female Disability Comparison
Barbadians
Immigrants from Jordan
12.6%
FEMALE DISABILITY
3.6/ 100
METRIC RATING
239th/ 347
METRIC RANK
11.5%
FEMALE DISABILITY
99.7/ 100
METRIC RATING
80th/ 347
METRIC RANK
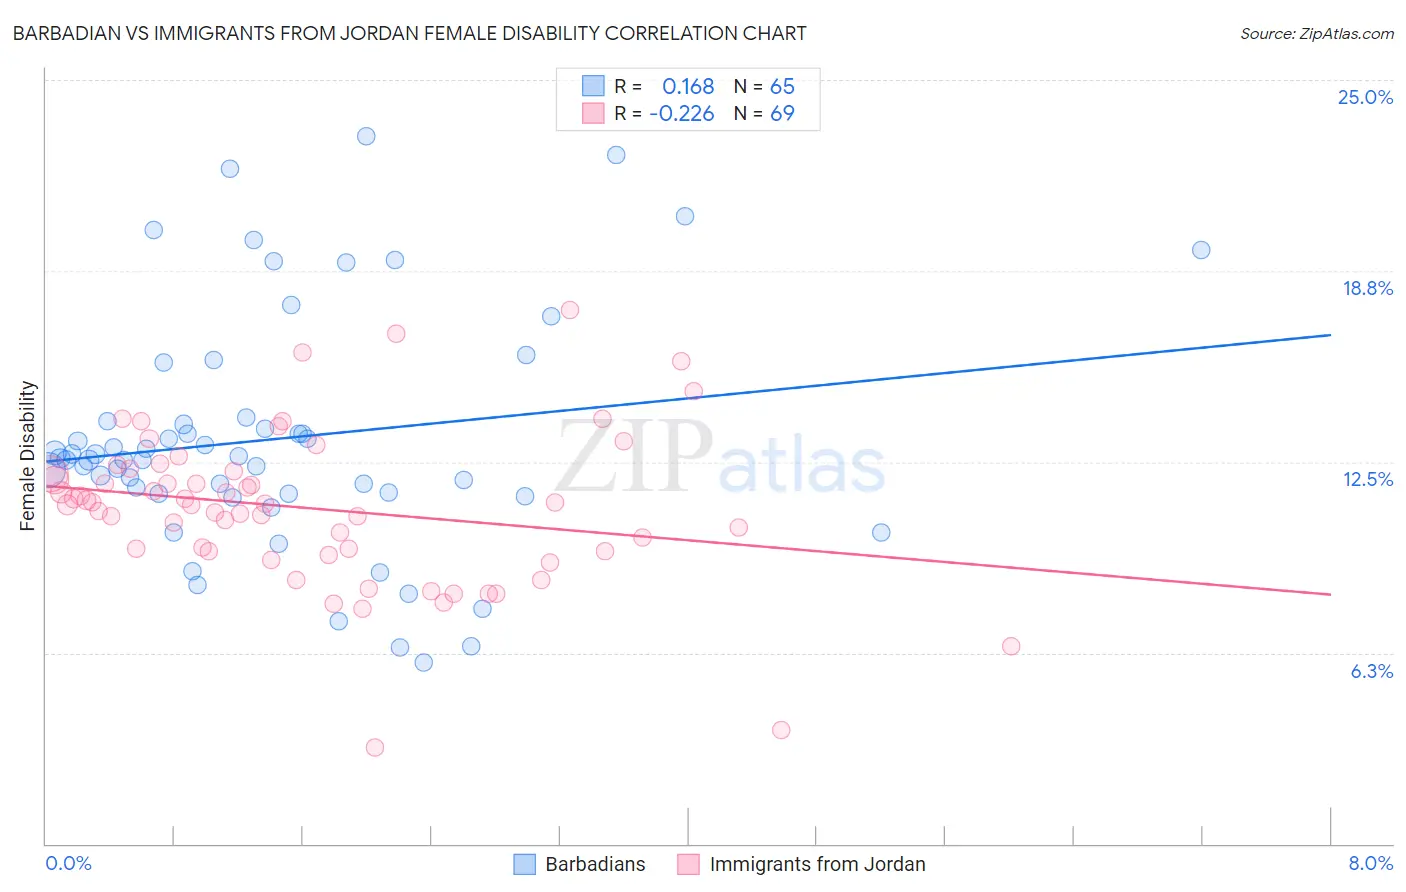
Barbadian vs Immigrants from Jordan Female Disability Correlation Chart
The statistical analysis conducted on geographies consisting of 141,302,135 people shows a poor positive correlation between the proportion of Barbadians and percentage of females with a disability in the United States with a correlation coefficient (R) of 0.168 and weighted average of 12.6%. Similarly, the statistical analysis conducted on geographies consisting of 181,274,102 people shows a weak negative correlation between the proportion of Immigrants from Jordan and percentage of females with a disability in the United States with a correlation coefficient (R) of -0.226 and weighted average of 11.5%, a difference of 9.1%.
Female Disability Correlation Summary
| Measurement | Barbadian | Immigrants from Jordan |
| Minimum | 5.9% | 3.2% |
| Maximum | 23.2% | 17.5% |
| Range | 17.2% | 14.3% |
| Mean | 13.3% | 11.0% |
| Median | 12.6% | 11.1% |
| Interquartile 25% (IQ1) | 11.5% | 9.6% |
| Interquartile 75% (IQ3) | 13.9% | 12.2% |
| Interquartile Range (IQR) | 2.4% | 2.6% |
| Standard Deviation (Sample) | 3.9% | 2.6% |
| Standard Deviation (Population) | 3.9% | 2.5% |
Similar Demographics by Female Disability
Demographics Similar to Barbadians by Female Disability
In terms of female disability, the demographic groups most similar to Barbadians are Yugoslavian (12.6%, a difference of 0.030%), Slavic (12.6%, a difference of 0.060%), German Russian (12.6%, a difference of 0.090%), Immigrants from West Indies (12.6%, a difference of 0.19%), and Japanese (12.6%, a difference of 0.26%).
| Demographics | Rating | Rank | Female Disability |
| Immigrants | Somalia | 5.9 /100 | #232 | Tragic 12.5% |
| Immigrants | Iraq | 5.3 /100 | #233 | Tragic 12.5% |
| Scandinavians | 5.3 /100 | #234 | Tragic 12.5% |
| Malaysians | 5.0 /100 | #235 | Tragic 12.5% |
| Immigrants | West Indies | 4.4 /100 | #236 | Tragic 12.6% |
| Slavs | 3.8 /100 | #237 | Tragic 12.6% |
| Yugoslavians | 3.7 /100 | #238 | Tragic 12.6% |
| Barbadians | 3.6 /100 | #239 | Tragic 12.6% |
| German Russians | 3.2 /100 | #240 | Tragic 12.6% |
| Japanese | 2.7 /100 | #241 | Tragic 12.6% |
| Canadians | 2.6 /100 | #242 | Tragic 12.6% |
| Immigrants | Senegal | 2.5 /100 | #243 | Tragic 12.6% |
| Alsatians | 2.5 /100 | #244 | Tragic 12.6% |
| Immigrants | Jamaica | 2.2 /100 | #245 | Tragic 12.6% |
| Spanish American Indians | 2.1 /100 | #246 | Tragic 12.6% |
Demographics Similar to Immigrants from Jordan by Female Disability
In terms of female disability, the demographic groups most similar to Immigrants from Jordan are Sierra Leonean (11.5%, a difference of 0.010%), Immigrants from South Africa (11.5%, a difference of 0.030%), Immigrants from Eritrea (11.5%, a difference of 0.040%), Immigrants from Afghanistan (11.5%, a difference of 0.040%), and Immigrants from Lebanon (11.5%, a difference of 0.080%).
| Demographics | Rating | Rank | Female Disability |
| Immigrants | Switzerland | 99.8 /100 | #73 | Exceptional 11.5% |
| Bhutanese | 99.8 /100 | #74 | Exceptional 11.5% |
| Immigrants | Lebanon | 99.7 /100 | #75 | Exceptional 11.5% |
| Immigrants | Eritrea | 99.7 /100 | #76 | Exceptional 11.5% |
| Immigrants | Afghanistan | 99.7 /100 | #77 | Exceptional 11.5% |
| Immigrants | South Africa | 99.7 /100 | #78 | Exceptional 11.5% |
| Sierra Leoneans | 99.7 /100 | #79 | Exceptional 11.5% |
| Immigrants | Jordan | 99.7 /100 | #80 | Exceptional 11.5% |
| Eastern Europeans | 99.7 /100 | #81 | Exceptional 11.5% |
| Luxembourgers | 99.6 /100 | #82 | Exceptional 11.6% |
| Immigrants | Serbia | 99.6 /100 | #83 | Exceptional 11.6% |
| Immigrants | Poland | 99.6 /100 | #84 | Exceptional 11.6% |
| Palestinians | 99.6 /100 | #85 | Exceptional 11.6% |
| Immigrants | Cameroon | 99.6 /100 | #86 | Exceptional 11.6% |
| Immigrants | Denmark | 99.5 /100 | #87 | Exceptional 11.6% |