Central American Indian vs Immigrants from Jordan Female Disability
COMPARE
Central American Indian
Immigrants from Jordan
Female Disability
Female Disability Comparison
Central American Indians
Immigrants from Jordan
13.6%
FEMALE DISABILITY
0.0/ 100
METRIC RATING
307th/ 347
METRIC RANK
11.5%
FEMALE DISABILITY
99.7/ 100
METRIC RATING
80th/ 347
METRIC RANK
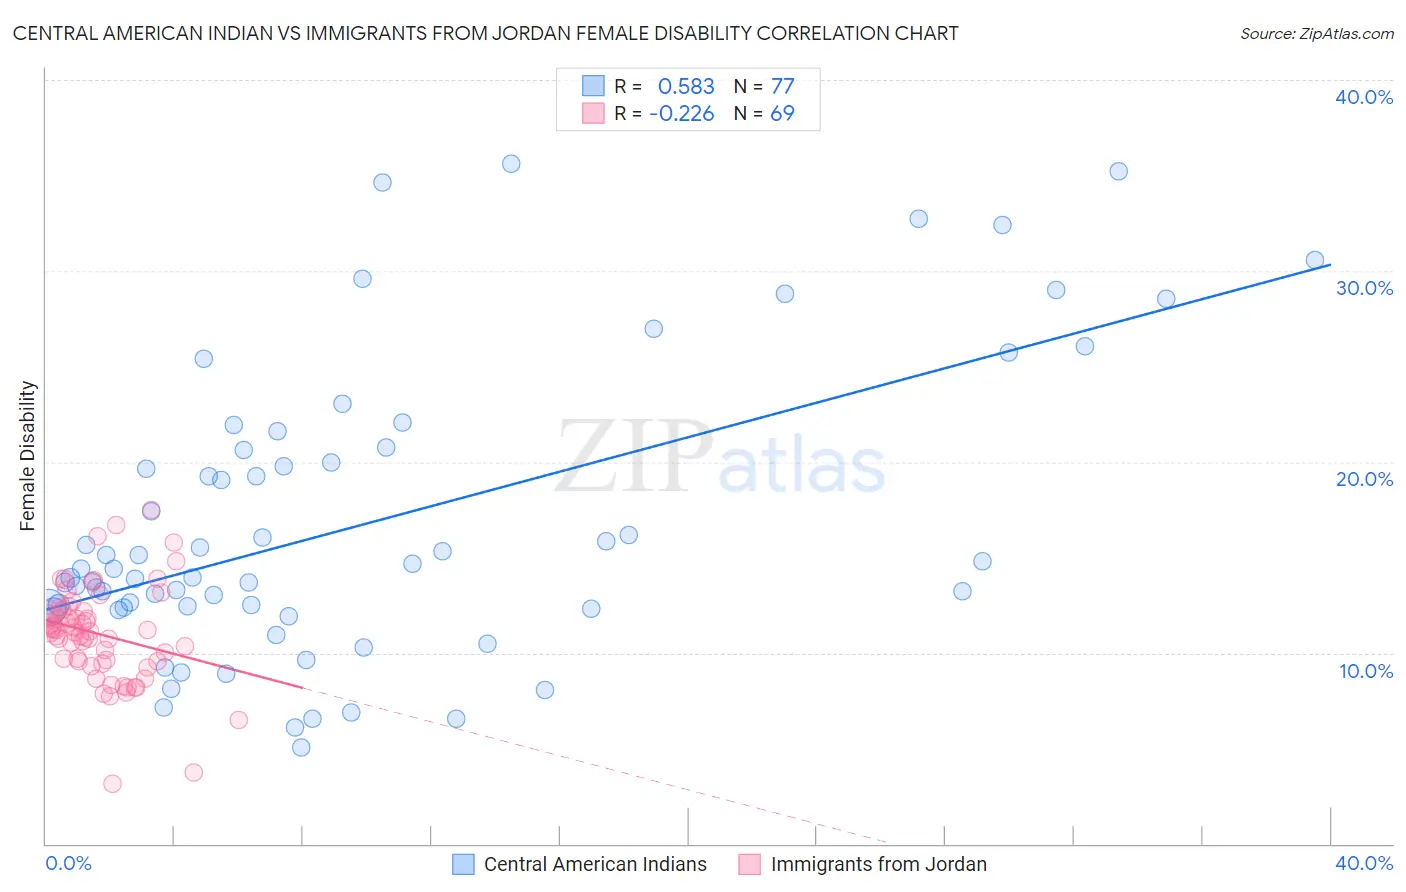
Central American Indian vs Immigrants from Jordan Female Disability Correlation Chart
The statistical analysis conducted on geographies consisting of 326,112,462 people shows a substantial positive correlation between the proportion of Central American Indians and percentage of females with a disability in the United States with a correlation coefficient (R) of 0.583 and weighted average of 13.6%. Similarly, the statistical analysis conducted on geographies consisting of 181,274,102 people shows a weak negative correlation between the proportion of Immigrants from Jordan and percentage of females with a disability in the United States with a correlation coefficient (R) of -0.226 and weighted average of 11.5%, a difference of 18.2%.
Female Disability Correlation Summary
| Measurement | Central American Indian | Immigrants from Jordan |
| Minimum | 5.1% | 3.2% |
| Maximum | 35.6% | 17.5% |
| Range | 30.5% | 14.3% |
| Mean | 16.8% | 11.0% |
| Median | 14.4% | 11.1% |
| Interquartile 25% (IQ1) | 12.3% | 9.6% |
| Interquartile 75% (IQ3) | 20.7% | 12.2% |
| Interquartile Range (IQR) | 8.3% | 2.6% |
| Standard Deviation (Sample) | 7.6% | 2.6% |
| Standard Deviation (Population) | 7.5% | 2.5% |
Similar Demographics by Female Disability
Demographics Similar to Central American Indians by Female Disability
In terms of female disability, the demographic groups most similar to Central American Indians are French Canadian (13.6%, a difference of 0.29%), Cree (13.7%, a difference of 0.46%), French American Indian (13.7%, a difference of 0.52%), Apache (13.7%, a difference of 0.63%), and Dominican (13.5%, a difference of 0.92%).
| Demographics | Rating | Rank | Female Disability |
| Pennsylvania Germans | 0.0 /100 | #300 | Tragic 13.4% |
| Africans | 0.0 /100 | #301 | Tragic 13.4% |
| Scotch-Irish | 0.0 /100 | #302 | Tragic 13.4% |
| Immigrants | Portugal | 0.0 /100 | #303 | Tragic 13.5% |
| Immigrants | Micronesia | 0.0 /100 | #304 | Tragic 13.5% |
| Dominicans | 0.0 /100 | #305 | Tragic 13.5% |
| French Canadians | 0.0 /100 | #306 | Tragic 13.6% |
| Central American Indians | 0.0 /100 | #307 | Tragic 13.6% |
| Cree | 0.0 /100 | #308 | Tragic 13.7% |
| French American Indians | 0.0 /100 | #309 | Tragic 13.7% |
| Apache | 0.0 /100 | #310 | Tragic 13.7% |
| Hopi | 0.0 /100 | #311 | Tragic 13.7% |
| Delaware | 0.0 /100 | #312 | Tragic 13.8% |
| Blackfeet | 0.0 /100 | #313 | Tragic 13.8% |
| Puget Sound Salish | 0.0 /100 | #314 | Tragic 13.8% |
Demographics Similar to Immigrants from Jordan by Female Disability
In terms of female disability, the demographic groups most similar to Immigrants from Jordan are Sierra Leonean (11.5%, a difference of 0.010%), Immigrants from South Africa (11.5%, a difference of 0.030%), Immigrants from Eritrea (11.5%, a difference of 0.040%), Immigrants from Afghanistan (11.5%, a difference of 0.040%), and Immigrants from Lebanon (11.5%, a difference of 0.080%).
| Demographics | Rating | Rank | Female Disability |
| Immigrants | Switzerland | 99.8 /100 | #73 | Exceptional 11.5% |
| Bhutanese | 99.8 /100 | #74 | Exceptional 11.5% |
| Immigrants | Lebanon | 99.7 /100 | #75 | Exceptional 11.5% |
| Immigrants | Eritrea | 99.7 /100 | #76 | Exceptional 11.5% |
| Immigrants | Afghanistan | 99.7 /100 | #77 | Exceptional 11.5% |
| Immigrants | South Africa | 99.7 /100 | #78 | Exceptional 11.5% |
| Sierra Leoneans | 99.7 /100 | #79 | Exceptional 11.5% |
| Immigrants | Jordan | 99.7 /100 | #80 | Exceptional 11.5% |
| Eastern Europeans | 99.7 /100 | #81 | Exceptional 11.5% |
| Luxembourgers | 99.6 /100 | #82 | Exceptional 11.6% |
| Immigrants | Serbia | 99.6 /100 | #83 | Exceptional 11.6% |
| Immigrants | Poland | 99.6 /100 | #84 | Exceptional 11.6% |
| Palestinians | 99.6 /100 | #85 | Exceptional 11.6% |
| Immigrants | Cameroon | 99.6 /100 | #86 | Exceptional 11.6% |
| Immigrants | Denmark | 99.5 /100 | #87 | Exceptional 11.6% |