Hmong vs Immigrants from Jordan Female Disability
COMPARE
Hmong
Immigrants from Jordan
Female Disability
Female Disability Comparison
Hmong
Immigrants from Jordan
13.1%
FEMALE DISABILITY
0.0/ 100
METRIC RATING
284th/ 347
METRIC RANK
11.5%
FEMALE DISABILITY
99.7/ 100
METRIC RATING
80th/ 347
METRIC RANK
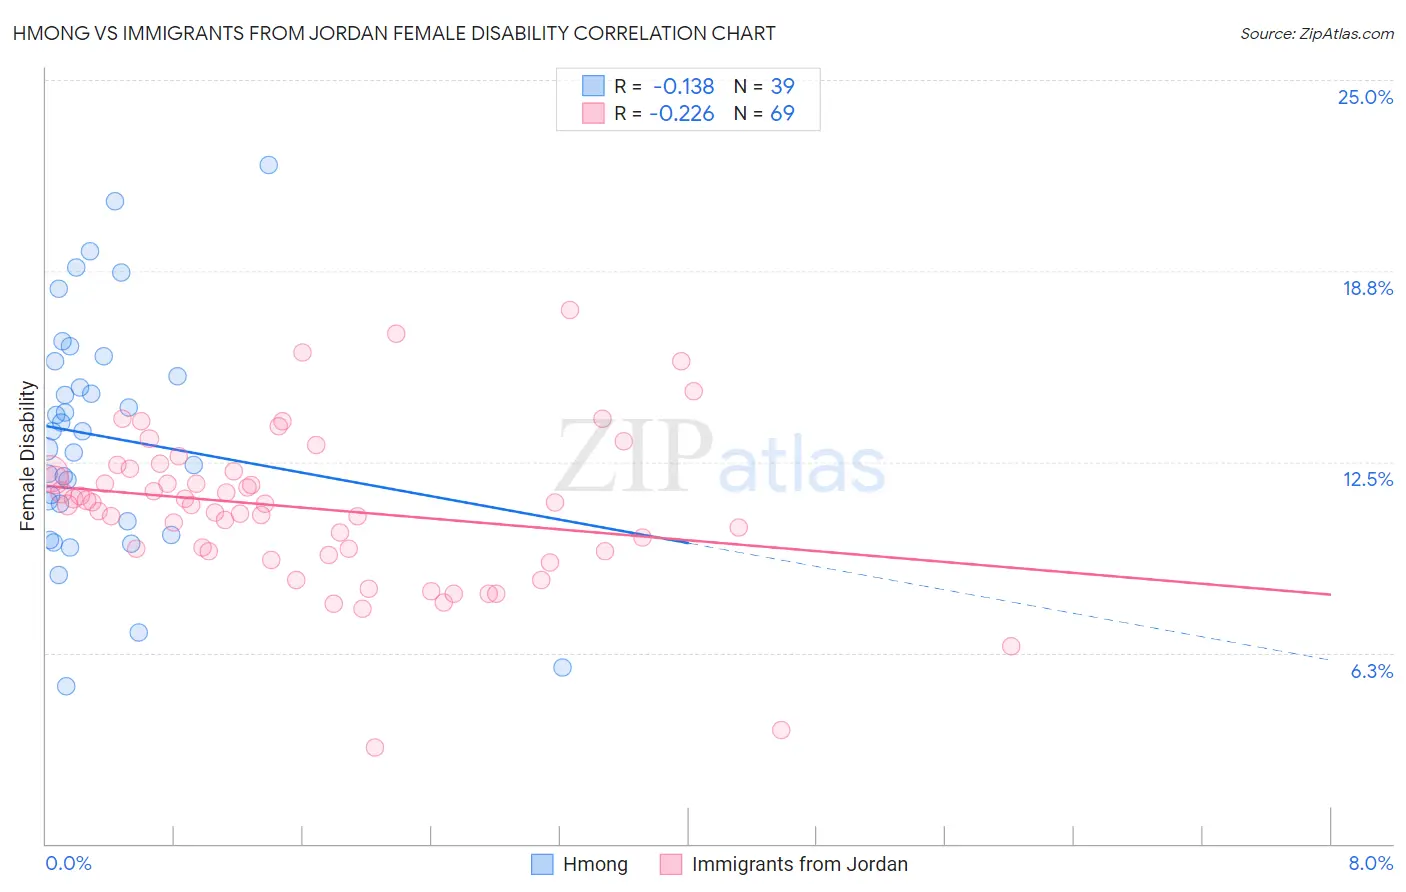
Hmong vs Immigrants from Jordan Female Disability Correlation Chart
The statistical analysis conducted on geographies consisting of 24,681,034 people shows a poor negative correlation between the proportion of Hmong and percentage of females with a disability in the United States with a correlation coefficient (R) of -0.138 and weighted average of 13.1%. Similarly, the statistical analysis conducted on geographies consisting of 181,274,102 people shows a weak negative correlation between the proportion of Immigrants from Jordan and percentage of females with a disability in the United States with a correlation coefficient (R) of -0.226 and weighted average of 11.5%, a difference of 13.6%.
Female Disability Correlation Summary
| Measurement | Hmong | Immigrants from Jordan |
| Minimum | 5.1% | 3.2% |
| Maximum | 22.2% | 17.5% |
| Range | 17.1% | 14.3% |
| Mean | 13.3% | 11.0% |
| Median | 13.5% | 11.1% |
| Interquartile 25% (IQ1) | 10.5% | 9.6% |
| Interquartile 75% (IQ3) | 15.8% | 12.2% |
| Interquartile Range (IQR) | 5.2% | 2.6% |
| Standard Deviation (Sample) | 3.9% | 2.6% |
| Standard Deviation (Population) | 3.8% | 2.5% |
Similar Demographics by Female Disability
Demographics Similar to Hmong by Female Disability
In terms of female disability, the demographic groups most similar to Hmong are Bangladeshi (13.1%, a difference of 0.050%), Fijian (13.1%, a difference of 0.10%), English (13.1%, a difference of 0.13%), Welsh (13.1%, a difference of 0.14%), and U.S. Virgin Islander (13.1%, a difference of 0.22%).
| Demographics | Rating | Rank | Female Disability |
| Spanish | 0.1 /100 | #277 | Tragic 13.0% |
| Scottish | 0.1 /100 | #278 | Tragic 13.0% |
| Arapaho | 0.1 /100 | #279 | Tragic 13.0% |
| Irish | 0.1 /100 | #280 | Tragic 13.1% |
| U.S. Virgin Islanders | 0.1 /100 | #281 | Tragic 13.1% |
| Welsh | 0.0 /100 | #282 | Tragic 13.1% |
| English | 0.0 /100 | #283 | Tragic 13.1% |
| Hmong | 0.0 /100 | #284 | Tragic 13.1% |
| Bangladeshis | 0.0 /100 | #285 | Tragic 13.1% |
| Fijians | 0.0 /100 | #286 | Tragic 13.1% |
| Yaqui | 0.0 /100 | #287 | Tragic 13.2% |
| Whites/Caucasians | 0.0 /100 | #288 | Tragic 13.2% |
| Tlingit-Haida | 0.0 /100 | #289 | Tragic 13.2% |
| Immigrants | Yemen | 0.0 /100 | #290 | Tragic 13.2% |
| Shoshone | 0.0 /100 | #291 | Tragic 13.2% |
Demographics Similar to Immigrants from Jordan by Female Disability
In terms of female disability, the demographic groups most similar to Immigrants from Jordan are Sierra Leonean (11.5%, a difference of 0.010%), Immigrants from South Africa (11.5%, a difference of 0.030%), Immigrants from Eritrea (11.5%, a difference of 0.040%), Immigrants from Afghanistan (11.5%, a difference of 0.040%), and Immigrants from Lebanon (11.5%, a difference of 0.080%).
| Demographics | Rating | Rank | Female Disability |
| Immigrants | Switzerland | 99.8 /100 | #73 | Exceptional 11.5% |
| Bhutanese | 99.8 /100 | #74 | Exceptional 11.5% |
| Immigrants | Lebanon | 99.7 /100 | #75 | Exceptional 11.5% |
| Immigrants | Eritrea | 99.7 /100 | #76 | Exceptional 11.5% |
| Immigrants | Afghanistan | 99.7 /100 | #77 | Exceptional 11.5% |
| Immigrants | South Africa | 99.7 /100 | #78 | Exceptional 11.5% |
| Sierra Leoneans | 99.7 /100 | #79 | Exceptional 11.5% |
| Immigrants | Jordan | 99.7 /100 | #80 | Exceptional 11.5% |
| Eastern Europeans | 99.7 /100 | #81 | Exceptional 11.5% |
| Luxembourgers | 99.6 /100 | #82 | Exceptional 11.6% |
| Immigrants | Serbia | 99.6 /100 | #83 | Exceptional 11.6% |
| Immigrants | Poland | 99.6 /100 | #84 | Exceptional 11.6% |
| Palestinians | 99.6 /100 | #85 | Exceptional 11.6% |
| Immigrants | Cameroon | 99.6 /100 | #86 | Exceptional 11.6% |
| Immigrants | Denmark | 99.5 /100 | #87 | Exceptional 11.6% |