Pima vs Immigrants from Jordan 10th Grade
COMPARE
Pima
Immigrants from Jordan
10th Grade
10th Grade Comparison
Pima
Immigrants from Jordan
91.2%
10TH GRADE
0.0/ 100
METRIC RATING
304th/ 347
METRIC RANK
94.1%
10TH GRADE
87.6/ 100
METRIC RATING
140th/ 347
METRIC RANK
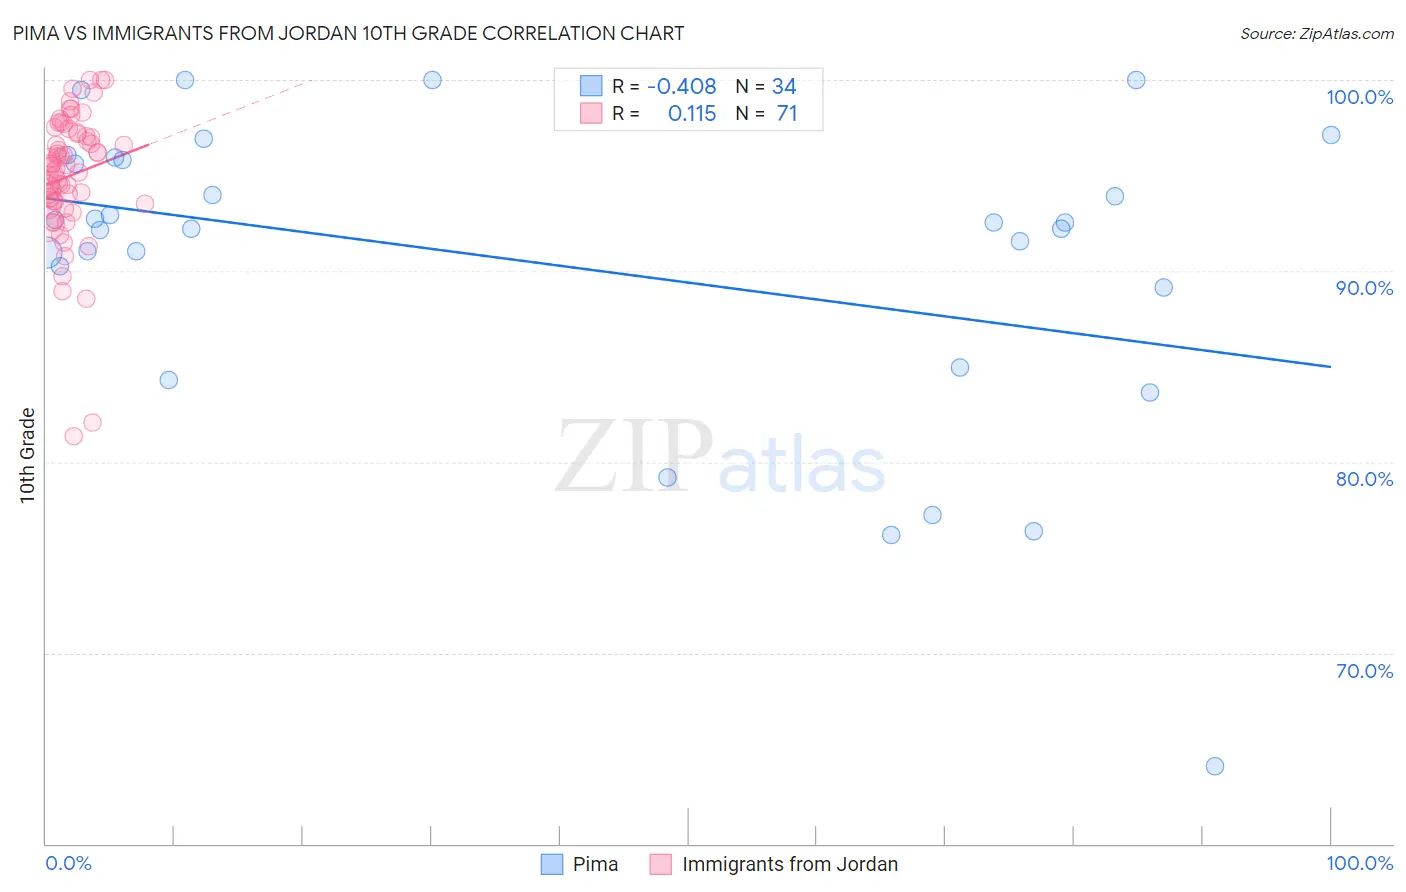
Pima vs Immigrants from Jordan 10th Grade Correlation Chart
The statistical analysis conducted on geographies consisting of 61,552,942 people shows a moderate negative correlation between the proportion of Pima and percentage of population with at least 10th grade education in the United States with a correlation coefficient (R) of -0.408 and weighted average of 91.2%. Similarly, the statistical analysis conducted on geographies consisting of 181,278,272 people shows a poor positive correlation between the proportion of Immigrants from Jordan and percentage of population with at least 10th grade education in the United States with a correlation coefficient (R) of 0.115 and weighted average of 94.1%, a difference of 3.3%.
10th Grade Correlation Summary
| Measurement | Pima | Immigrants from Jordan |
| Minimum | 64.0% | 81.3% |
| Maximum | 100.0% | 100.0% |
| Range | 36.0% | 18.7% |
| Mean | 90.4% | 95.0% |
| Median | 92.4% | 95.5% |
| Interquartile 25% (IQ1) | 89.1% | 93.6% |
| Interquartile 75% (IQ3) | 95.8% | 97.2% |
| Interquartile Range (IQR) | 6.7% | 3.6% |
| Standard Deviation (Sample) | 8.0% | 3.4% |
| Standard Deviation (Population) | 7.9% | 3.4% |
Similar Demographics by 10th Grade
Demographics Similar to Pima by 10th Grade
In terms of 10th grade, the demographic groups most similar to Pima are Immigrants from Dominica (91.1%, a difference of 0.020%), Immigrants from Vietnam (91.2%, a difference of 0.060%), Japanese (91.2%, a difference of 0.080%), Immigrants from Guyana (91.2%, a difference of 0.080%), and Yaqui (91.1%, a difference of 0.080%).
| Demographics | Rating | Rank | 10th Grade |
| Fijians | 0.0 /100 | #297 | Tragic 91.5% |
| Cubans | 0.0 /100 | #298 | Tragic 91.5% |
| Immigrants | Haiti | 0.0 /100 | #299 | Tragic 91.4% |
| Guyanese | 0.0 /100 | #300 | Tragic 91.4% |
| Japanese | 0.0 /100 | #301 | Tragic 91.2% |
| Immigrants | Guyana | 0.0 /100 | #302 | Tragic 91.2% |
| Immigrants | Vietnam | 0.0 /100 | #303 | Tragic 91.2% |
| Pima | 0.0 /100 | #304 | Tragic 91.2% |
| Immigrants | Dominica | 0.0 /100 | #305 | Tragic 91.1% |
| Yaqui | 0.0 /100 | #306 | Tragic 91.1% |
| Immigrants | Fiji | 0.0 /100 | #307 | Tragic 91.0% |
| Immigrants | Bangladesh | 0.0 /100 | #308 | Tragic 91.0% |
| Immigrants | Immigrants | 0.0 /100 | #309 | Tragic 91.0% |
| Vietnamese | 0.0 /100 | #310 | Tragic 90.9% |
| Immigrants | Cambodia | 0.0 /100 | #311 | Tragic 90.9% |
Demographics Similar to Immigrants from Jordan by 10th Grade
In terms of 10th grade, the demographic groups most similar to Immigrants from Jordan are Hmong (94.1%, a difference of 0.020%), Albanian (94.1%, a difference of 0.020%), Immigrants from Bosnia and Herzegovina (94.2%, a difference of 0.040%), Immigrants from Sri Lanka (94.2%, a difference of 0.050%), and Cherokee (94.1%, a difference of 0.050%).
| Demographics | Rating | Rank | 10th Grade |
| Creek | 91.9 /100 | #133 | Exceptional 94.2% |
| Osage | 91.7 /100 | #134 | Exceptional 94.2% |
| Immigrants | Korea | 91.3 /100 | #135 | Exceptional 94.2% |
| Shoshone | 90.8 /100 | #136 | Exceptional 94.2% |
| Arapaho | 90.5 /100 | #137 | Exceptional 94.2% |
| Immigrants | Sri Lanka | 89.9 /100 | #138 | Excellent 94.2% |
| Immigrants | Bosnia and Herzegovina | 89.4 /100 | #139 | Excellent 94.2% |
| Immigrants | Jordan | 87.6 /100 | #140 | Excellent 94.1% |
| Hmong | 86.6 /100 | #141 | Excellent 94.1% |
| Albanians | 86.5 /100 | #142 | Excellent 94.1% |
| Cherokee | 84.9 /100 | #143 | Excellent 94.1% |
| Immigrants | Kazakhstan | 84.9 /100 | #144 | Excellent 94.1% |
| Immigrants | Nonimmigrants | 83.8 /100 | #145 | Excellent 94.1% |
| Chickasaw | 82.6 /100 | #146 | Excellent 94.1% |
| Immigrants | Ukraine | 81.5 /100 | #147 | Excellent 94.0% |